78 results
Free 2nd grade statistics independent works
Skittles Line Plot Activity
Suggestions for this lesson:
-Use this as an assessment piece based on the work you have already done in working on understanding line plots in your classroom
-Use this as a reward activity that is still curriculum based.
-Use this as a review for the end of a unit.
-Use this as an introduction to line plots in your classroom as a “hook.”
Things you will need:
-A class set of print outs from this packet for your class
-An anchor chart to explain to students how to create a line plot (I suggest
Subjects:
Grades:
2nd - 4th
Types:
Probability Task Cards
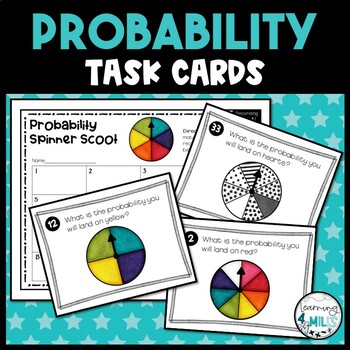
Probability SCOOT Game is an easy way to get students moving while learning probability in a fun way. This resource includes 16 SCOOT cards that show eighths, sixths, fourths, thirds, and halves. All cards are in spinner form and come in color and black/white. Included-16 Scoot Cards- Recording SheetClick Here for the full product with a Math Book!__________________________________________________________________Feedback and Reviews♥I would love to hear how you use these activities in your class
Subjects:
Grades:
2nd - 4th
Types:
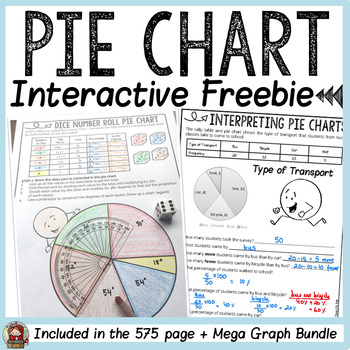
PIE CHARTS/ PIE GRAPHS/ CIRCLE GRAPHS FREEBIE
This freebie on interpreting and creating a pie chart is a sampler activity from the Mega Graphs Bundle.ITEMS INCLUDED✅ A poster defining a Pie Chart.✅ A one-page activity sheet to interpret collated data on mode of transport to school.✅ A one-page activity sheet that requires students to roll a dice and collect and interpret data. They will also find the percent and proportion of each sector to construct a pie chart using a protractor.✅ Answer key/completed sample of each graphing activity.****
Subjects:
Grades:
2nd - 6th
Types:
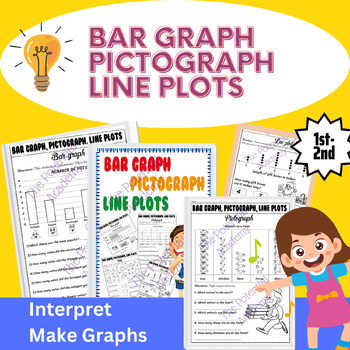
Bar Graphs, Pictographs, Line Plots, Tally Graph worksheet - Types of graph
Are you looking for a mix of no-prep activities for bar graphs, pictographs, and line plots? This Bar Graph, Pictograph, Tally, and Line Plots pack includes a variety of exercises for practicing reading graphs, showing data, and analyzing data on bar graphs, pictographs, and line plots in no time!The two main activities, reading graphs and drawing graphs, were designed with different practices to enhance their understanding of working with bar graphs, pictographs, tally, and line plots. There ar
Subjects:
Grades:
1st - 2nd
Types:
Centimeter & 1 Inch Grid Papers (Full Sheets Each)
A full sheet of Centimeter Grid Paper and a full sheet of 1 inch Grid Paper all contained in one easy to transport/store .pdf. You can use these sheets with making charts, plotting points, etc... Enjoy and thank you for your support.
Subjects:
Grades:
PreK - 12th, Higher Education, Adult Education, Staff
Types:
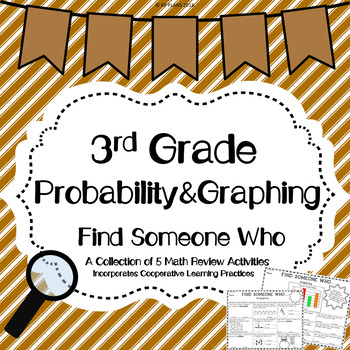
Graphing And Probability Find Someone Who Activity FREE
A collection of 5 Find Someone Who Activities focusing on Probability and Graphing
Includes:
Probability
Bar Graph
Pictograph
Line Plot
Possible Outcomes/Combinations
Great for cooperative learning! My students love this fun Kagan activity! Includes answer key as well!
VA Math SOL Standards:
SOL 3.18
Common Core:
3.MD.B.3 ,
Interested in other Find Someone Who Activities? Click Here!
Find Someone Who Money
Find Someone Who Multi Digit Multiplication
Find Someone Who Division
Find Someo
Subjects:
Grades:
2nd - 4th
Types:
Also included in: Find Someone Who Math Bundle
Intro to Probability, Mean, Median, Mode, and Range
In an effort to make high quality educational material more accessible to parents and teachers alike, regardless of location and/or socioeconomic status, I have decided to post lessons I create on here for FREE. The products I make consist mostly of Google Slides in PDF format for K-8th grade students. They cover a wide range of subject matter, but focus mainly on math and language development. Each lesson is created with the intention of keeping students attentive and actively engaged by using
Subjects:
Grades:
2nd - 4th
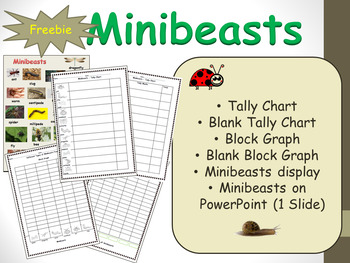
Count and Graph Minibeasts Tally Chart Block Graph Project and Activity Sheets
This math and science link freebie relates to minibeasts - bugs and insects topic. There is a display of common minibeasts, a tally chart and block graph for students to complete whenever they see a minibeast.Also included:- blank tally chart and blank block graph - Students have the option of naming and sketching the minibeasts they find.A useful printable freebie - all you need are clipboards and pencils.The minibeasts are also displayed on PowerPoint - discuss with the students the kind of m
Subjects:
Grades:
K - 2nd
Types:
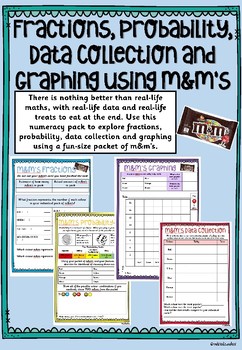
Fractions, Probability, Data Collection and Graphing using M&M's
There is nothing better than real-life maths, with real-life data and real-life treats to eat at the end. Use this numeracy pack to explore fractions, probability, data collection and graphing using a fun-size packet of m&m’s.
Subjects:
Grades:
2nd - 4th
Types:
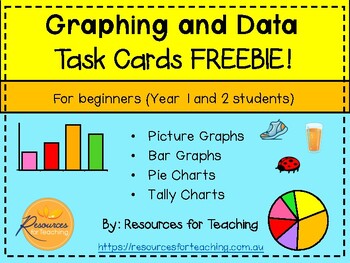
Graphing and Data Task Cards FREEBIE! Year 1 and 2 Students
This FREEBIE includes 16 differentiated task cards for Year 1 and 2 students who are learning how to analyse and interpret data graphs. This is a sample of our '48 Graphing and Data Task Cards' that are great for your whole class! To get the FULL RESOURCE click on the link HERE!This download comes with 3 of each 4 graph styles: picture graphs, bar graphs, pie charts and tally charts. Each graph/ chart comes with a question below which require students to analyse the data and record their answer
Subjects:
Grades:
1st - 3rd
Types:
Survey & Graphing Activity/Assessment
This is an activity where students create and conduct their own survey, organize the results in the form of a bar graph and answer questions regarding the results.I use this as a final assessment for the graphing unit, however, it could definitely be used as a practice worksheet. You could also replace the 2nd page (graphing) with a blank paper if you would like your students to make a different type of graph and still use the first and last page.*Couple explanations- The big box on page 1 with
Subjects:
Grades:
1st - 2nd
Types:
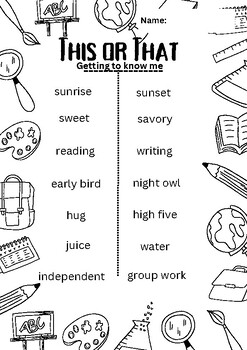
This or That
Get to know your students with this quick task. Provoking conversation and allowing students to nominate their likes and dislikes. Ext- Gather data, collating and discuss the groups preferences. Includes a blank page for students to create and share their own.
Grades:
K - 5th
Types:
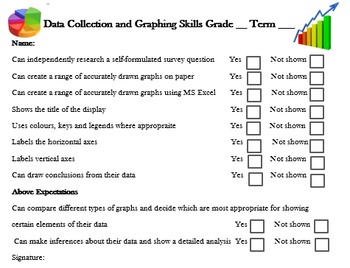
Graph and Data Assessment Checklist & Rubric
Short and quick-to-mark assessment rubric and checklist for graphing tasks suitable for students from grades 2 to 6.
You may also like:
-Comprehensive Multiplication Unit for free
- All Materials Maths units, just click on my store logo to view the full range.
Full set of Maths Assessments:
- Place Value Assessment
- Addition Assessment
- Subtraction Assessment
- Multiplication Assessment
- Division Assessment
- Fractions/Decimals Assessment
Subjects:
Grades:
2nd - 6th
Types:
Data Analysis & Probability - Drill Sheets Gr. PK-2 - BONUS WORKSHEETS
This FREE bonus resource includes extension activity worksheets from our Data Analysis & Probability - Drill Sheets Gr. PK-2 title.Enjoy 6 BONUS worksheets from Data Analysis & Probability - Drill Sheets Gr. PK-2. These worksheets can be used on their own, or paired with the individual resources as extension activities at the completion of the unit. And the best part is, it's FREE.About these BONUS Worksheets:Written to grade and NCTM standards, these math concepts are presented in a wa
Subjects:
Grades:
PreK - 2nd
Types:
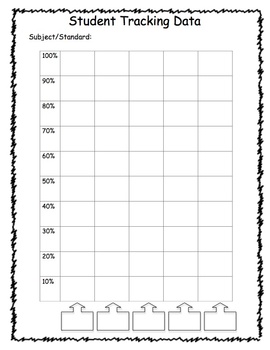
Data Tracking Graph
Use this handout to graph any standard/data you wish. Fill in the blanks at the bottom of the graph and use the vertical axis to chart the %age of each assessment/test that you wish to chart.
Subjects:
Grades:
1st - 5th
Types:
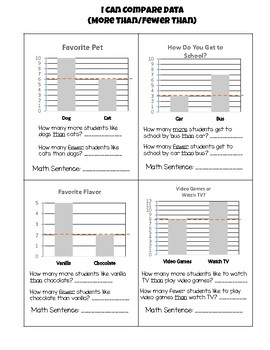
I Can Compare Data in Bar Graphs (More Than Fewer Than)
This worksheet contains practice exercises for comparing data in bar graphs (more than/fewer than).You may also like:More Than/Less Than (Comparing Data in Bar Graphs)
Subjects:
Grades:
K - 2nd
Types:
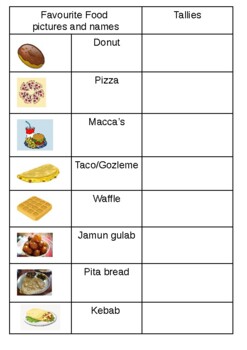
Maths - Data representation - favourite food pictograph activity cut and paste
Australian (Victorian Curriculum Year 1 and 2 levels), Maths - statistics and probability - Gathering data in a pictograph, modelling with class p.1, and task p. 2-4.Page 1 can be used as a teacher model and class data collection and pages 2-4 is the task for students that may use this for cut and paste activity to represent data using pictures for a pictograph. Foods are relatable to students of all countries.
Subjects:
Grades:
PreK - 4th
Types:
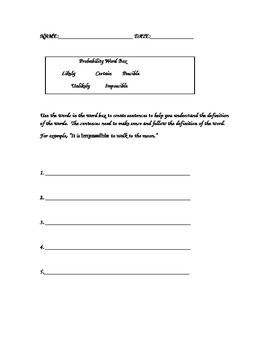
Math Sentences using Probability Terms
After learning the definitions of common probability terms, certain, possible, likely, unlikely and impossible, students will be asked to write sentence using the terms. This exercise can be used as part of a math station, as math homework or as an extension.
Subjects:
Grades:
2nd - 4th
Types:
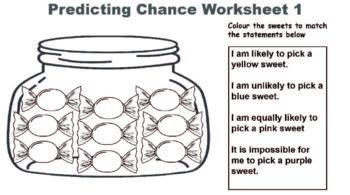
Predicting Chance Worksheet
Predicting probability worksheet ready to print and use. Suitable for years 2 - 6.
Subjects:
Grades:
1st - 6th
Types:
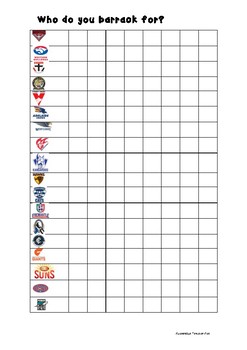
*FREEBIE* AFL Footy Day Data Collection - Who do you barrack for?
A simple table with all the AFL teams. Children go around and ask peers which team they barrack for and collect the data on the table by colouring or ticking the box.
Subjects:
Grades:
PreK - 6th
Types:
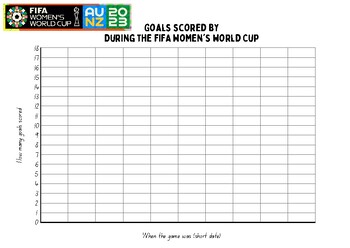
2023 FIFA Women's World Cup Goal Line Graph Template
Let's celebrate the FIFA Women's World Cup and engage students in gathering data. This template is designed for students to track goals scored by a single team throughout the World Cup. It could also be used to compare with a different colour being used for each team.Use this data to further Statistical Investigation skills and support rich real-world Maths learning. This is designed to work with the 2023 FIFA Women's World Cup Data Recording Google Form, 2023 FIFA Women's World Cup Data Recordi
Subjects:
Grades:
2nd - 12th
Types:
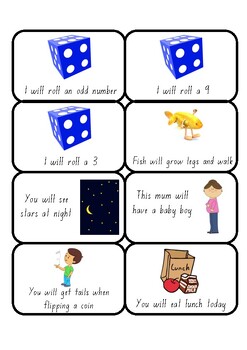
Chance Cards
Students decide whether the chance of these events occurring are 'impossible,' 'unlikely,' 'likely,' 'even,' 'certain' and can glue under the correct heading.
Subjects:
Grades:
K - 4th
Types:
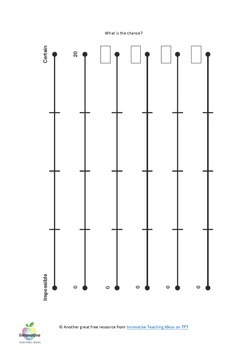
FREE Chance and Probability Graphic Organizer | Odds | Data | Math
The purpose of this tool is to assist students in assessing the mathematical chance or probability of an event occurring. For instance, you might raise the following questions.What is the chance of rain in July?What is the chance of a golfer hitting a hole-in-one on a short par three hole?What is the chance of someone in our school wearing pink socks?What is the chance of (insert team name) winning a championship this season?This organizer is an excellent tool for starting the mathematical und
Subjects:
Grades:
1st - 6th
Showing 1-24 of 78 results


