368 results
Free 9th grade statistics independent works
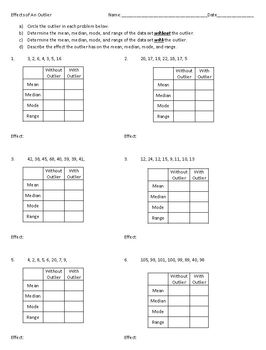
Effects of an Outlier on Mean, Median, Mode, and Range
This worksheet helps reinforce the effect of an outlier on the mean, median, mode, and range of a data set. Six data sets are provided. Students must calculate the mean, median, mode, and range of each data set with the outlier included, then with the outlier excluded. They must then determine what effect the outlier has on these statistics when included in the data set. A complete answer key is also provided.
Subjects:
Grades:
6th - 9th
Types:
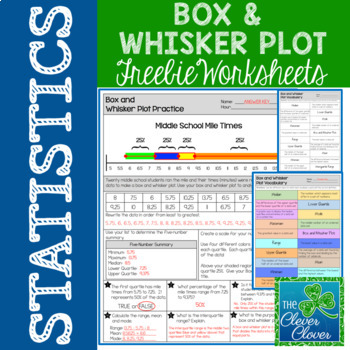
Box and Whisker Plot - FREEBIE
This resource can be used for practice with creating and interpreting box and whisker plots. Students will use twenty mile times in order to calculate the five number summary. Space is provided for students to list the numbers in order from least to greatest. Students are directed to shade and label each quartile of the box and whisker plot. After the plot has been drawn, students can answer six questions pertaining to the data.
Practice with vocabulary is also important. Students can use
Subjects:
Grades:
6th - 9th, Adult Education
Types:
Also included in: Statistics Bundle - Guided Notes, Worksheets & Scavenger Hunts!
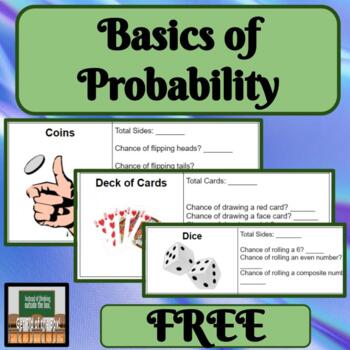
Basics of Probability Dice Cards Coins
About this Resource:Many students do not know all that is needed about dice, coins, and decks of cards. In order to be successful, it is important to cover all of this information first. Topic Covered:*Probability Ways to use this product in your classroom:-whole class-exploration-hands-on-small group-independent Other products with similar content.M&M's ProbabilityBox Plots with WeatherVisuals with Measures of Central TendencyCreating Line Plots
Subjects:
Grades:
6th - 9th
Types:
Also included in: Probability Bundle Hands On Dice Cards Coins Simple Probability
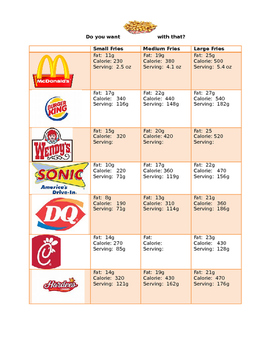
French Fry Scatter Plot & Best Line of Fit
Students will compare the nutritional values and serving sizes of french fries from various fast food restaurants. Based on this information, they will create scatter plots, best lines of fit and the equation of the trend line. Using the equation, they will estimate the unknown values of kid meals and supersized portions of french fries.
Subjects:
Grades:
8th - 11th
Types:
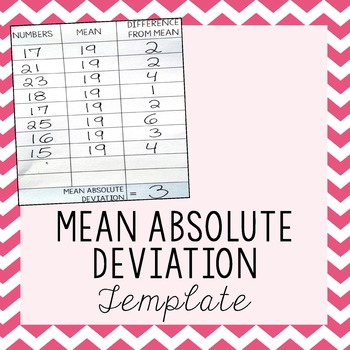
Mean Absolute Deviation Template
I created this template to help my students work through the steps of calculating Mean Absolute Deviation. The helped my students immensely and I hope it will help yours as well.I hope you will explore my other Mean Absolute Deviation products to help complete your unit:Mean Absolute Deviation MazeMean Absolute Deviation Activity with Zombies!Related Resourceso Click Here for more 8th Grade Math activitiesThis product is also part of the following money saving bundle:8th Grade Math Bundle - All
Subjects:
Grades:
6th - 12th
Types:
Also included in: 8th Grade Math Bundle ~ All My 8th Grade Math Products at 1 Low Price
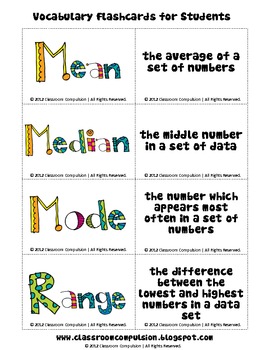
FREE Mean Median Mode Range Fun Flashcards
This is a freebie from my Mean, Median, Mode, and Range Pack. These are fun, colorful flashcards that your students can use to help them learn math vocabulary.
Subjects:
Grades:
3rd - 9th
Types:
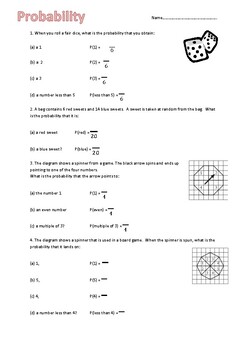
FREEBIE! - Scaffolded basic probability worksheet
This worksheet is perfect for low ability, SEN and struggling students to help support them in finding basic probabilities. The worksheet has fractions included and students have to fill in the missing spaces. A good supporting worksheet for an intro into probability. Answer key included.
Subjects:
Grades:
7th - 9th
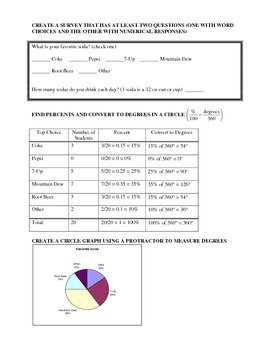
Construct a Survey Lesson/Project Plan
This PDF document consists of three parts: a lesson plan, project instructions, and a grading rubric. The lesson has students construct a survey that will have at least two questions: one that is multiple choice and one that has a numerical answer. It can either be an individual assignment or a group assignment and takes 2-3 days. I used this towards the end of the year as a review exercise since it covers multiple concepts: percents, circle graphs, central tendency (with outliers), box-and-whis
Subjects:
Grades:
6th - 9th
Types:
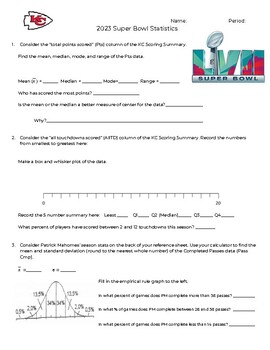
2023 Super Bowl Statistics Activity
This activity contains two stats sheets - one for the Philadelphia Eagles and one for the Kansas City Chiefs. Students are asked to use the data from the various tables to answer questions about the teams. This activity covers 1 variable statistics (mean, median, mode, range, standard deviation, box-and-whisker plot, histogram, two-way tables).This would be great as a partner activity or class activity.
Subjects:
Grades:
7th - 12th
Types:
CCSS:
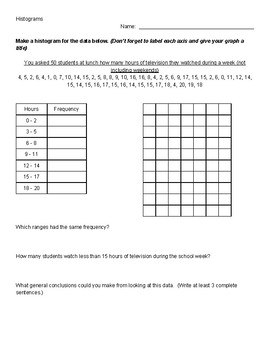
Histograms
Students will practice making histograms and manipulating bin width to see the change in frequency.
Subjects:
Grades:
6th - 9th
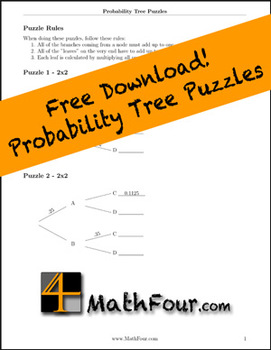
Probability Tree Puzzles
Using probability tree diagrams to teach probability is helpful - but sometimes kids need a little practice with them.
This worksheet has 11 probability tree diagrams to be "worked" as puzzles. This gives students practice filling them in and understanding the dynamics.
Once they have this practice, they can effectively use probability trees diagrams as tools.
Make sure you also download my Probability Trees Explained free "cheat sheet."
Subjects:
Grades:
8th - 12th, Higher Education
Types:
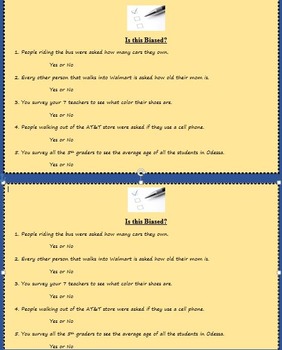
Is this Biased? (populations and random samples)
This is a 5 question quiz, exit ticket, do now, or homework assignment that reviews how surveys and samples can be biased sometimes. All 5 can be answered with a yes or no for whether it is indeed a biased survey. Enjoy and please rate and/or comment on this product!
Subjects:
Grades:
5th - 9th
Types:
Statistics: Plots, Shapes of Distributions, Choosing Mean or Median
Statistics Integrated Review: Plots, Shapes of Distributions, and Statistics for Center and SpreadUse common data plots to determine shape of the data distribution, and choose appropriate statistics for center and spread. This product includes a one-page integrated review with a worksheet and answer key aligned with the common core. Students practice identifying the shape of a data distribution using common data plots (dot plot, histogram, and boxplot). Students also review how to choose appropr
Subjects:
Grades:
8th - 12th
Types:
CCSS:
Also included in: Bundle: Algebra 1 Statistics Unit Curriculum (Common Core)
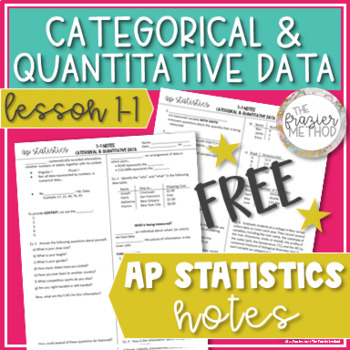
AP Statistics Notes - Categorical and Quantitative Variables, Data Table, FREE
With definitions, examples, & practice problems, these AP Statistics notes will help you teach or review CATEGORICAL & QUANTITATIVE VARIABLES whether you’re teaching in-person or distance learning! Students will define data, context, cases, records, respondents, subjects, participants, experimental units, and variables. In addition to distinguishing between categorical, quantitative, and identifier variables, AP Statistics students will write a context sentence using the 5 W’s and identi
Subjects:
Grades:
9th - 12th
Types:
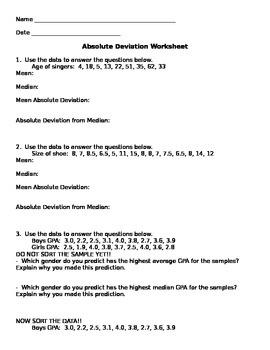
Mean Absolute Deviation Worksheet
Students will practice finding measures of central tendency and then calculate the mean absolute deviation as well as the absolute deviation from the median.
Subjects:
Grades:
6th - 10th
Types:
CCSS:
Centimeter & 1 Inch Grid Papers (Full Sheets Each)
A full sheet of Centimeter Grid Paper and a full sheet of 1 inch Grid Paper all contained in one easy to transport/store .pdf. You can use these sheets with making charts, plotting points, etc... Enjoy and thank you for your support.
Subjects:
Grades:
PreK - 12th, Higher Education, Adult Education, Staff
Types:
Probability Addition Rules Guided Notes (Mutually Exclusive and Overlapping)
Probability Addition Rules Guided Notes
This set of guided notes focuses on finding the probability mutually exclusive and overlapping events. All of the problems feature the key word "OR." For example, students might have to find the probability of choosing an ace or a spade from a standard deck of cards.
These fill in the blank notes include 3 examples and 5 practice problems. I have included the full size notes as well as the notes printed 2 to a page, which fits well in a spiral notebook
Subjects:
Grades:
6th - 12th
CCSS:
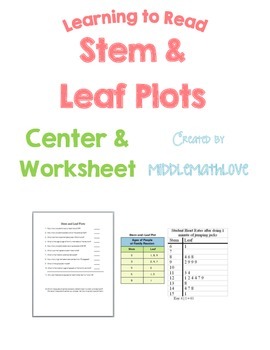
Data Analysis Worksheet - Reading & Analyzing Stem and Leaf Plots
This product is perfect for an introductory or review lesson on understanding how to read stem and leaf plots. Post the data displays on the SmartBoard or print out copies for each student. Students answer questions on the worksheet by reading and analyzing the graphs.
Stem and Leaf Plot Activity Includes:
--1 Stem and Leaf Plot Student Worksheet
--2 slides of Stem and Leaf Plots
I combined this product with my other data analysis worksheets (box and whisker plots and histograms) to create
Subjects:
Grades:
7th - 10th
Types:
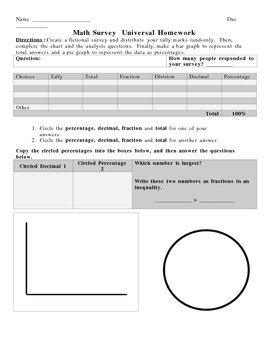
Take A Survey -- Learn Fractions, Percents and Decimals
This is a project that helps students learn to compute fractions, decimals and percents. The preview is a "universal" homework that students can complete for review any time during the year.
Take A Survey -- Learn Fractions, Percents and Decimals by Sherre Vernon is licensed under a Creative Commons Attribution-Share Alike 3.0 United States License.
Subjects:
Grades:
6th - 12th, Higher Education, Adult Education
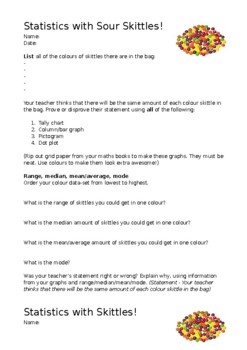
FUN Statistics with M&Ms and Skittles!
FUN Statistics worksheet for skittles, sour skittles, and M&Ms. Kids to work in groups (4-6 students per group works best). Buy one pack of skittles or sour skittles or M&Ms per group. Includes: Mean/average, mode, median, range. Graphs: Tally chart, dot plot, bar/column graph, pictogram. Edit to suit what you have covered in class.
Subjects:
Grades:
5th - 10th
Types:
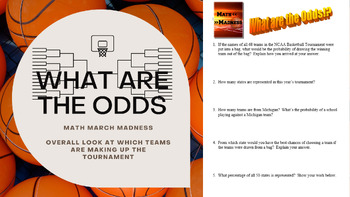
Math March Madness - What are the Odds!? (Overall Stats of Tournament Make Up)
Math + March Madness = Golden Learning Opportunities! Refocus those off topic conversations about march madness that come into the classroom into productive discussions from the math perspective! Students will be excited to work with this authentic, real world math application of probability and statistics. This assignment can be used after tourney teams are announced, but before all the action begins to research stats on teams that will be competing as well as answer a few probability questi
Subjects:
Grades:
6th - 12th, Higher Education
Types:
CCSS:
FREEBIE Probability Vocabulary and Formula Study Sheets (Common Core Aligned)
These probability study sheets provide a quick way for students to review essential vocabulary and formulas, including probability rules, as part of a high school probability unit. Probability Study Sheets include vocabulary and formulas on the following topics:Sample spaces; outcomes; events; two-way frequency table; conditional probability; union; intersection; complement; two-way frequency table; independent events; Venn diagrams; addition rule; complement; probability rules; complement rule;
Subjects:
Grades:
9th - 12th
Types:
CCSS:
Also included in: Bundle: Probability Unit Curriculum (Common Core)
Interquartile Range (IQR) & Box-and-Whisker Plot Review
This is a half sheet document with four questions to review both interquartile range and box-and-whisker plots. Can be used in an interactive notebook or as an exit ticket.No teacher prep for one page in an interactive notebook! Or you may use it as a quick exit ticket at the end of a class period. Very flexible with how you want to use the four questions. Save paper with the one sheet to two students ratio!Answer key is included for all four problems.I want to improve my products. If you have a
Subjects:
Grades:
6th - 9th
Correlation vs. Causation Information Sheet Freebie
Help students distinguish between causation and correlation. This info sheet give definitions and examples of correlation that are often called causation. It is a great way to start discussions and get students thinking. The page explains why causation is difficult to prove and how a study would need to have a control group. Students are prompted to look for real articles and point out correlation being used to imply causation (which happens a lot)!
Subjects:
Grades:
8th - 11th
Types:
CCSS:
Also included in: 8th Grade Math Activities & Lessons Bundle for the Whole Year
Showing 1-24 of 368 results


