155 results
Free 4th grade statistics independent works
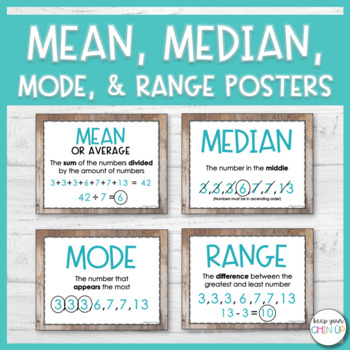
Mean, Median, Mode, and Range Posters
Looking for a visual to help your students with determining the mean, median, mode, and range of a data set? These simple posters are designed to help your students remember key words and formulas for each of the terms.
WHAT'S INCLUDED?
► 2 Options for printing (color or black & white)
► Posters for the terms: mean, median, mode, range, and data set
► Vocabulary worksheet
► Practice worksheet
Subjects:
Grades:
4th - 6th
Types:
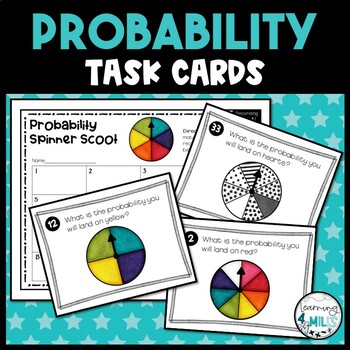
Probability Task Cards
Probability SCOOT Game is an easy way to get students moving while learning probability in a fun way. This resource includes 16 SCOOT cards that show eighths, sixths, fourths, thirds, and halves. All cards are in spinner form and come in color and black/white. Included-16 Scoot Cards- Recording SheetClick Here for the full product with a Math Book!__________________________________________________________________Feedback and Reviews♥I would love to hear how you use these activities in your class
Subjects:
Grades:
2nd - 4th
Types:
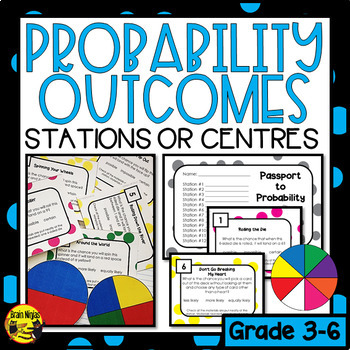
Describing Probability Outcomes Task Cards
Your students can explore probability by moving through twelve stations that each pose a question which can be answered with more likely, less likely, equally likely, possible, impossible or certain. This easy to use product includes:instructions to set up the stations (or use the activities as task cards).templates to make spinners (both in colour and ink-saving options).student recording pages.task cards for twelve stations (with materials listed on each card).answer key.One questions reads: W
Subjects:
Grades:
3rd - 6th
Types:
FREE Water Bottle Flip Line Plot Activity
Have your student flip water bottles and see how many times they successfully flip it! Record data and create a line plot!
Check out my other line plot activity here!
Fidget Spinner Line Plot
Subjects:
Grades:
3rd - 8th
Types:
Also included in: Probability Activity BUNDLE
Skittles Line Plot Activity
Suggestions for this lesson:
-Use this as an assessment piece based on the work you have already done in working on understanding line plots in your classroom
-Use this as a reward activity that is still curriculum based.
-Use this as a review for the end of a unit.
-Use this as an introduction to line plots in your classroom as a “hook.”
Things you will need:
-A class set of print outs from this packet for your class
-An anchor chart to explain to students how to create a line plot (I suggest
Subjects:
Grades:
2nd - 4th
Types:
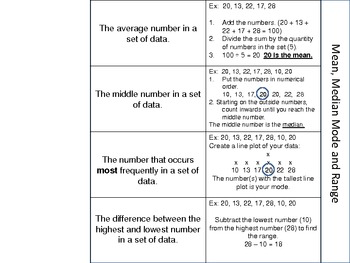
Mean, Median, Mode & Range Math Foldable
You can use this foldable to introduce mean, median, mode and range. Students can easily paste it into their notebooks or file it away in a math folder!
Subjects:
Grades:
4th - 6th
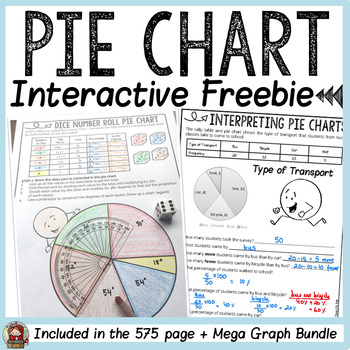
PIE CHARTS/ PIE GRAPHS/ CIRCLE GRAPHS FREEBIE
This freebie on interpreting and creating a pie chart is a sampler activity from the Mega Graphs Bundle.ITEMS INCLUDED✅ A poster defining a Pie Chart.✅ A one-page activity sheet to interpret collated data on mode of transport to school.✅ A one-page activity sheet that requires students to roll a dice and collect and interpret data. They will also find the percent and proportion of each sector to construct a pie chart using a protractor.✅ Answer key/completed sample of each graphing activity.****
Subjects:
Grades:
2nd - 6th
Types:
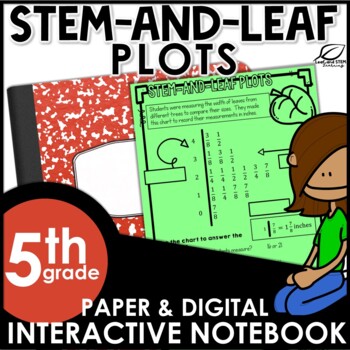
Stem-and-Leaf Plots Interactive Notebook Set | FREE | Distance Learning
Introduce creating and solving one-step and two-step problems using stem and leaf plots. This interactive math notebook set focuses on the Texas TEKS 5.9A and 5.9C. Parts of this set are also appropriate for use with Texas TEKS 4.9A and 4.9B. The stem-and-leaf plots included in this math interactive notebook set use whole numbers, fractions, and decimal values. Also included are a practice activity and a writing activity as well as a 4 question formative test prep style assessment. This fun
Subjects:
Grades:
4th - 6th
Also included in: 5th Grade Math Interactive Notebook - ALL TEKS - ALL CCSS
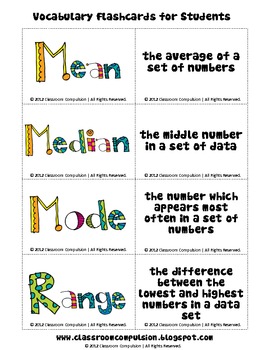
FREE Mean Median Mode Range Fun Flashcards
This is a freebie from my Mean, Median, Mode, and Range Pack. These are fun, colorful flashcards that your students can use to help them learn math vocabulary.
Subjects:
Grades:
3rd - 9th
Types:
Probability Practice Galore!
A great resource for teaching Probability! These two mini-booklets contain large images to use for word study or as anchor charts, two worksheets involving spinners and probability lines, and extra probability worksheets. It's likely that these will come in handy!
Subjects:
Grades:
3rd - 6th
Types:
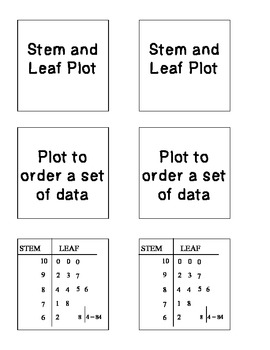
Types of Graphs Foldable-FREEBIE
Types of graphs foldable cards. Two per page. Great to use with a shutterfold.
Graphs included: Stem and Leaf, Line Plot, Line Graph, Bar Graph, Frequency Table, Circle Graph
Used for note taking purposes.
Subjects:
Grades:
3rd - 8th
Types:
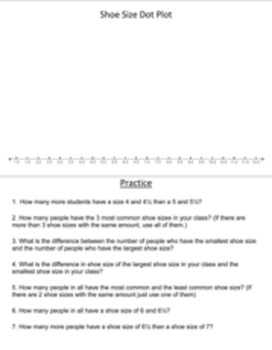
Shoe Size Dot Plot
Introduce Dot Plots by using this activity in your classroom. Collect the information with your class and fill in the dot plot. There are also high level comprehension questions to go along with the dot plot to assess your students knowledge. This would also go into an interactive journal or notebook. This activity covers the NEW 2014-2015 Math TEK 4.9(A) summarize a data set with multiple categories using a frequency table, dot plot, pictograph, or bar graph with scaled intervals.
Subjects:
Grades:
3rd - 6th
Types:
CCSS:
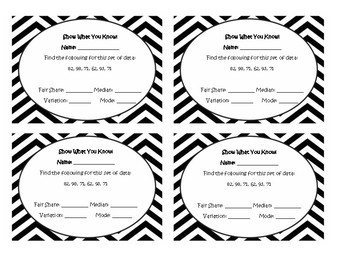
FREEBIE Mean Median Mode and Range Exit Slip
This exit/entrance ticket freebie is a quick check for understanding on finding the mean, median, mode and range of data. It uses vocabulary words like "fair share" for the mean and "variation" for the range in alignment with the Virginia SOL 5.16.
All exit slip template/background credits and copyright go to Alina Veja at https://www.teacherspayteachers.com/Store/Alina-Veja. Go check out her store for more info!
Subjects:
Grades:
4th - 6th
Types:
Centimeter & 1 Inch Grid Papers (Full Sheets Each)
A full sheet of Centimeter Grid Paper and a full sheet of 1 inch Grid Paper all contained in one easy to transport/store .pdf. You can use these sheets with making charts, plotting points, etc... Enjoy and thank you for your support.
Subjects:
Grades:
PreK - 12th, Higher Education, Adult Education, Staff
Types:

Mean, Median, Range, Mode Quiz
This is a five problem math quiz. It can be used for a quiz, but also as a review. There are five sets of numbers where students must find the mean, median, range, and mode of each data set. The numbers are not in numerical order.
Subjects:
Grades:
3rd - 8th
Types:
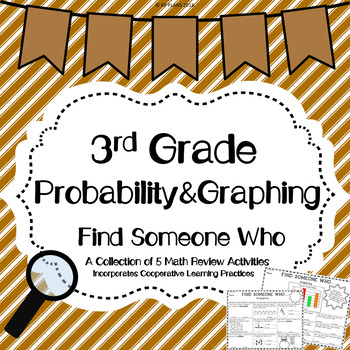
Graphing And Probability Find Someone Who Activity FREE
A collection of 5 Find Someone Who Activities focusing on Probability and Graphing
Includes:
Probability
Bar Graph
Pictograph
Line Plot
Possible Outcomes/Combinations
Great for cooperative learning! My students love this fun Kagan activity! Includes answer key as well!
VA Math SOL Standards:
SOL 3.18
Common Core:
3.MD.B.3 ,
Interested in other Find Someone Who Activities? Click Here!
Find Someone Who Money
Find Someone Who Multi Digit Multiplication
Find Someone Who Division
Find Someo
Subjects:
Grades:
2nd - 4th
Types:
Also included in: Find Someone Who Math Bundle
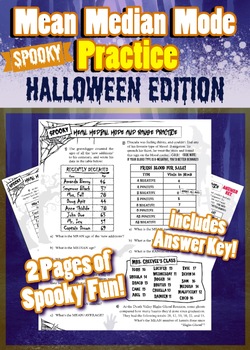
Halloween Mean Median Mode Range Practice - Spooky and Fun Math Handout
Spooky and FUN Mean Median Mode Range Practice - Halloween Printable ActivityEven your most ghoulish students will love this handout! It's full of hilarious scenarios and monster names, and includes lots of spooky fonts and icons. Your students will be so entertained by this printable, that they'll forget they're improving their math skills while using it.Since each problem on the handout is a multi-part problem, this handout features over 25 chances for students to improve their statistical ana
Subjects:
Grades:
4th - 9th, Adult Education
Types:
Data Analysis & Probability - Drill Sheets Gr. 3-5 - BONUS WORKSHEETS
This FREE bonus resource includes extension activity worksheets from our Data Analysis & Probability - Drill Sheets Gr. 3-5 title.Enjoy 6 BONUS worksheets from Data Analysis & Probability - Drill Sheets Gr. 3-5. These worksheets can be used on their own, or paired with the individual resources as extension activities at the completion of the unit. And the best part is, it's FREE.About these BONUS Worksheets:Written to grade and NCTM standards, these math concepts are presented in a way
Subjects:
Grades:
3rd - 5th
Types:
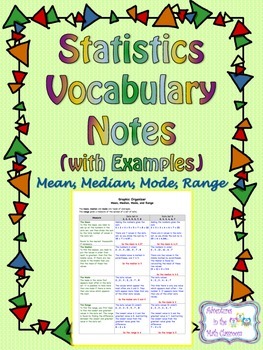
Statistics Vocabulary Notes - Mean, Median, Mode, Range
These color-coded vocabulary notes help students find the mean, median, mode, and range of a data set through example. There are two sets of data that are used to show students the different possible outcomes when it comes to finding the mean, median, mode, and range of a data set.
Subjects:
Grades:
4th - 9th
Types:
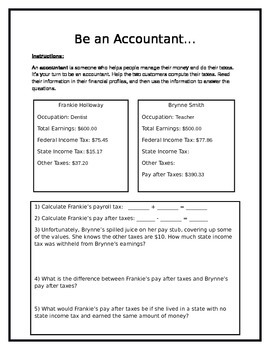
Financial Literacy
This product aligns with the 5th grade financial literacy TEKS. This product could be used as a check for understanding or a partner activity. You could extend this activity by asking the students to create their own personal profile.
Subjects:
Grades:
4th - 6th
Types:
- EXTRAIT - Le cycle d'une plante FRENCH SCIENCE ACTIVITY
Ce document est un extrait d'un document de 23 pages. L'extrait suivant contient 5 pages. Il porte sur le cycle d'une plante. Vous y trouverez deux pages avec des mots-étiquettes des étapes du cycle d'une plante ainsi qu'une évaluation en lien avec la notion.
CLIQUEZ ICI POUR ACCÉDER AU DOCUMENT ORIGINAL COMPLET.
Le document complet contient :
- la description du projet,
- les mots-étiquettes des étapes du cycle d'une plante,
- un cahier de l'élève de 11 pages (mise en situation, hypothèse,
Subjects:
Grades:
3rd - 4th
Types:
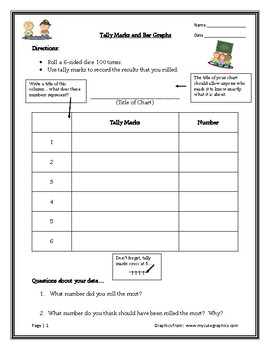
Tally Marks, Bar Graphs & Probability
Students will conduct an experiment by rolling a 6-sided die 100 times. They will record their results on a chart, using tally marks. The chart walks through how to complete it properly.Afterwards, students will take their data to construct a bar graph, and the sheet walks them through how to complete it. Finally, the last two pages ask students to work through probability. Definitions are provided.
This is a great package for self-directed learners or use as a whole class. It took my kidd
Subjects:
Grades:
3rd - 6th
Types:
Intro to Probability, Mean, Median, Mode, and Range
In an effort to make high quality educational material more accessible to parents and teachers alike, regardless of location and/or socioeconomic status, I have decided to post lessons I create on here for FREE. The products I make consist mostly of Google Slides in PDF format for K-8th grade students. They cover a wide range of subject matter, but focus mainly on math and language development. Each lesson is created with the intention of keeping students attentive and actively engaged by using
Subjects:
Grades:
2nd - 4th
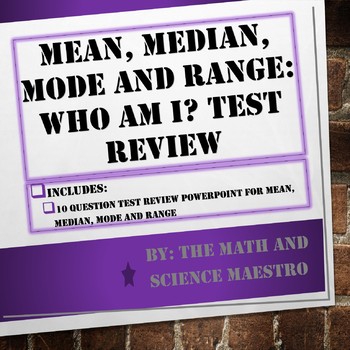
Mean, Median, Mode and Range: Who Am I? Test Review Powerpoint
Who Am I? Mean, Median, Mode or Range? Or am I more than one? Let's find out!
This free PowerPoint resource is perfect for a formative assessment at the end of a lesson, or could even be used as an opener with 2 questions per day for a week!
Students will be required to know which measures are of center, which one is of variation and real-life situations where they are used. This is editable as well, so feel free to add on to it!
Subjects:
Grades:
4th - 5th
Showing 1-24 of 155 results


