20 results
Free statistics independent works for Microsoft PowerPoint
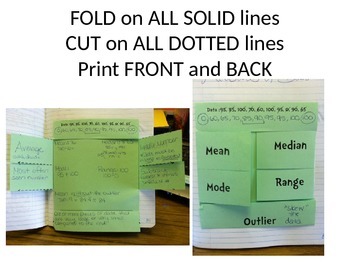
Mean, Median, Mode, Range, Outlier FOLDABLE
This is a download for a one page cut only foldable. Directions are simple, CUT on all dotted lines, FOLD on all solid lines. Gives you 6 flaps to write under with vocabulary on top.
Also includes one set of data to find the mean, median, mode and range (answers included).
This is downloaded in powerpoint, so it can be changed if you do not need the "oulier" topic.
Also, this is an EVEN number of data, so the median will have to be found between 2 numbers: 85 and 90.
This involves deci
Subjects:
Grades:
6th - 8th
Types:
Intro to Probability, Mean, Median, Mode, and Range
In an effort to make high quality educational material more accessible to parents and teachers alike, regardless of location and/or socioeconomic status, I have decided to post lessons I create on here for FREE. The products I make consist mostly of Google Slides in PDF format for K-8th grade students. They cover a wide range of subject matter, but focus mainly on math and language development. Each lesson is created with the intention of keeping students attentive and actively engaged by using
Subjects:
Grades:
2nd - 4th
Mean, Median, Mode and Range: Who Am I? Test Review Powerpoint
Who Am I? Mean, Median, Mode or Range? Or am I more than one? Let's find out!
This free PowerPoint resource is perfect for a formative assessment at the end of a lesson, or could even be used as an opener with 2 questions per day for a week!
Students will be required to know which measures are of center, which one is of variation and real-life situations where they are used. This is editable as well, so feel free to add on to it!
Subjects:
Grades:
4th - 5th
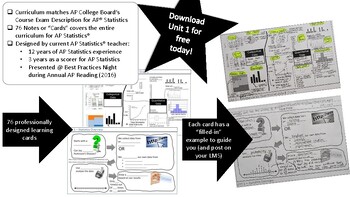
AP Statistics Learning Cards - Unit 1
AP Statistics' Learning Cards for Unit 1 are professionally designed fill-in-the-blank cards that match the AP Statistics Course Description6 cards in unit 1Word documents provide 2 different formats to present to studentsPowerPoint presentation fileAll documents are editable
Subjects:
Grades:
9th - 12th
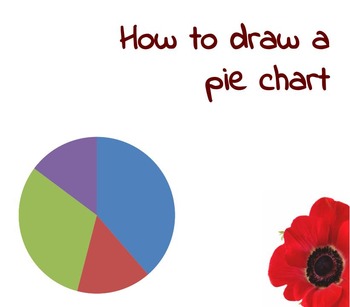
Data Handling - Drawing Pie Charts
Using Powerpoint when teaching pie charts enable the learners to see exactly what you are doing when you draw a pie chart. In the example I tried to set the powerpoint up exactly as you would do when you draw the graph by hand. This take the pain out of teaching pie charts and enable you to do it in much less time than before.
There is 2 more charts that the learners can then draw by themselves. The second one has an extension part that can lead to a good class discussion about time management.
Subjects:
Grades:
6th - 9th

Baseball Salaries! | Comparing 2 or More Numerical Distributions
Suppose you want to compare two or more numerical distributions. The best way to do this is by creating parallel boxplots. This lesson accomplishes this with explicit TI-84 keystroke instructions. In addition to learning how to construct parallel boxplots on a graphing calculator, students will additionally learn the following from participation in this activity:· the relationship between a boxplot and its corresponding histogram.· how to distinguish right skewness from left skewness using onl
Subjects:
Grades:
10th - 12th, Higher Education
Organizing and Visualizing Data: Population, Sample, Frequency, Graphs and Plots
z
Subjects:
Grades:
8th - 12th
CCSS:
Notes and examples: Ordering, Combinations, and Permutations
Slide deck to go along with the YouTube video found at https://www.youtube.com/watch?v=m1SKijvXru0
Subjects:
Grades:
10th - 12th, Adult Education
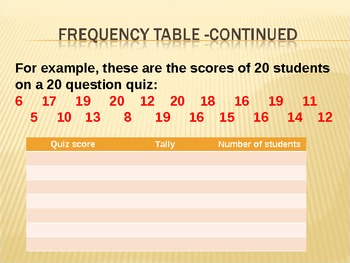
Frequency table and pie chart powerpoint
A PowerPoint presentation presenting data to the students in order to create frequency table and pie chart.
Subjects:
Grades:
5th - 6th

Statistics and Probability Lesson and Project
This item includes a powerpoint lesson about statistics and probability and a printable project handout using Skittles. I have used it with grades 7-9 (either as introductory or as review) for the topic. The powerpoint lesson includes notes, examples, practice questions, simple activities, teacher instructions, and the introduction for the followup project. The project is a printable pdf. that students complete either individually or in pairs to practice what they have learned. Some of the que
Subjects:
Grades:
7th - 9th
![Preview of [Digital Resource] Statistics Case Study: Histograms](https://ecdn.teacherspayteachers.com/thumbitem/-Digital-Resource-Statistics-Case-Study-Histograms-6615376-1614190475/original-6615376-1.jpg)
[Digital Resource] Statistics Case Study: Histograms
[Digital Resource] Statistics Case Study: HistogramsAbout this resource:This case study allows students to apply their knowledge of statistics on real-life, practical cases. Students will learn how to make histograms in Google Sheets according to the instructions in the case. Also, they will learn how to use the XLMiner Analysis Toolpak add-on provided by Google Sheets to make frequency tables, effective histograms and, thus, be able to draw relevant conclusions.This resource includes:* Editable
Subjects:
Grades:
9th - 12th, Higher Education

Dot Plot Guided Notes
Graphic Organizer for Dot Plots for Algebra 1 and Slides!!
Subjects:
Grades:
8th - 9th, Higher Education
Types:
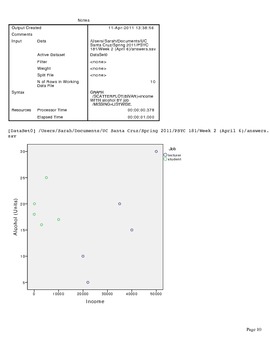
Exploring Data in SPSS and Constructing a Scatterplot
This worksheet guides students through exploring data and constructing a scatterplot in SPSS. It quizzes students on important terms as they work through the example.
Subjects:
Grades:
11th - 12th, Higher Education
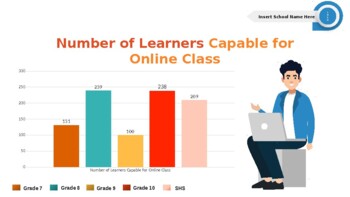
Animated School Report/Infographics for Staff and Teachers
This product is composed of different animated graphs/charts needed for school reports and statistics such as:Number of enrolleesNumber of DropoutsAssesment ResultsCapability of learning onlineNumber of transfereeAnd many more. All of them are editable for your own data.This is perfect for school heads/teachers/principals/staff.
Grades:
Not Grade Specific

Statistics-Basketball
find the mean, median, mode, and range for the basketball statistics. Answer the following questions based on the data you gather.
Subjects:
Grades:
5th - 8th
Types:
Venn Diagrams - Ratio PowerPoint Part 2
This PowerPoint has been made from the Queensland Curriculum Year 8 Maths unit. The Power Point has slides created from the content displayed in the Independent Learning Materials. Each slide works the students step by step through how to figure out ratio from the information supplied in the diagrams.
You can purchase the worksheet that I have designed to support this Power Point. The worksheet is $1.50. (Keep in mind that $1 of that money goes to TpT and I only get 50 cents) The worksheet is ti
Subjects:
Grades:
5th - 8th

ELECTORAL POLLING ERROR
“What happened? What went wrong?” people woke up to thinking the morning after the 2016 election. The polls were off. The other candidate won, and the unthinkable had happened. But it was sure not to happen again, at least for four years. Again, the unthinkable happened the morning after the 2020 election, and with not even all the ballots counted, the same thoughts circulated in so many heads as the underdog was almost at the finish line. So why do polling errors happen, and what can we do to p
Grades:
7th - 9th
Types:

Tips for Writing an Effective Questionnaire/Survey
This is a presentation we used for our Year 6 exhibition to assist them with writing questionnaires. It can easily be used for Upper Elementary or Middle School. It is a PowerPoint that can be edited. I reduced the text size so it could be uploaded to the free section of this website.
Grades:
5th - 8th
Types:
Ratio Practice
This activity will give your students great practice when beginning to learn about ratios! Assign it as independent work, use it as a whole group activity, or add it to your google classroom!
Subjects:
Grades:
4th - 6th
CCSS:
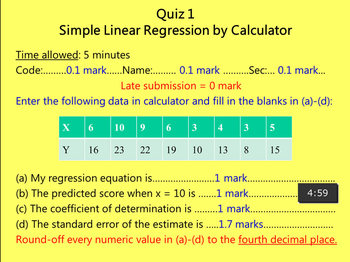
Auto-run Timed Classroom Quiz
A three-chart auto-run PowerPoint file
A visual countdown timer at every chart
Statistics - Simple Linear Regression and Correlation
Calculation
Subjects:
Grades:
12th, Higher Education, Adult Education, Staff
Showing 1-20 of 20 results


