11 results
Free statistics independent works for Microsoft Excel

Mean, Median, Mode, Range 3-Leveled Mario Pixel Art for Middle Schoolers
This MARIO pixel art activity has three different levels of mean, median, mode, range, and outlier problems. Gives teachers more flexibility to support individual student needs. This resource can be used in the classroom as a formative assessment, independent classwork, homework, or much more! Students will solve 10 equations to reveal a mystery image. Gives students automatic feedback and is no prep. Awesome activity to incorporate technology into the math classroom. Keep math fun and engaging
Subjects:
Grades:
6th - 8th
Types:
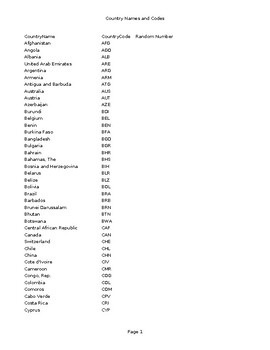
Guided Notes Data Supplement - Lesson 3.4
IB Applications & Interpretations:
Subjects:
Grades:
10th - 12th
Types:
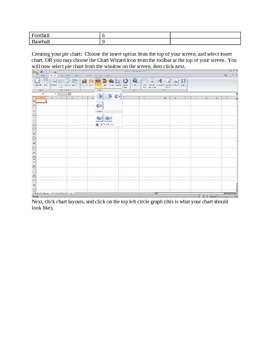
Excel Survey Project
I am Mr. Poole. I do this project with my math class, however, it could easily be adapted to other subjects. This survey project teaches students the basic functions of performing a survey and how to best present the results. Students will do the following: choose a topic to survey, formulate a question that they will ask people, predict what the outcomes may be, keep tally/frequencies of responses, input their data into an excel spreadsheet which will generate a circle/bar graph, design th
Subjects:
Grades:
5th - 8th
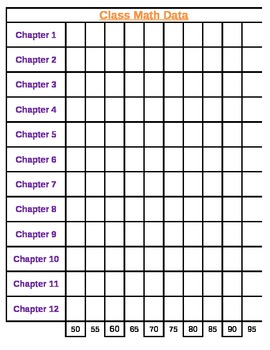
Math Class Data Sheet
Great for a class Data Wall!
This is an excel spreadsheet used to track yearly growth.
Enjoy!
Subjects:
Grades:
K - 12th
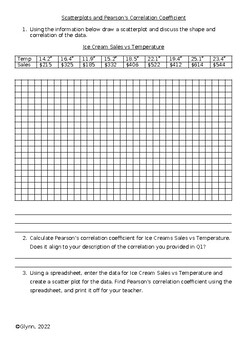
Scatterplots and Pearson's Correlation Activity
A quick activity to get students familiar with plotting scatterplots and using Pearson's correlation coefficient.
Subjects:
Grades:
10th - 11th
Types:
CCSS:
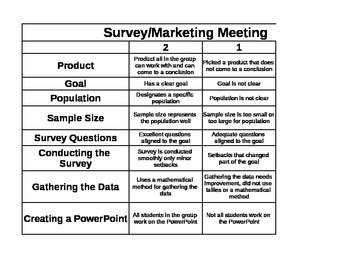
Survey/Marketing Meeting Rubric
This is a rubric I use for an end of unit project on statistics. Students work in groups, select a product they want to improve, create a survey, conduct the survey, analyze the data collected to market a new (improved) product. Students create a powere point or prezi to hold a marketing meeting for the class. Key Terms: sample size, population.
Subjects:
Grades:
6th - 9th
Types:
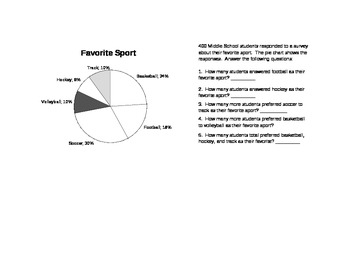
Pie Chart Practice
Printable Pie Charts from Microsoft Excel.
Have student evaluate the data in the chart and answer the provided questions.
Subjects:
Grades:
6th - 9th
Types:

2-Day Flipped Classroom Lesson: Linear Regression
This 2-day lesson contains several java manipulatives and instructional videos from Khan Academy to help students in 9th grade
Algebra to understand the concepts behind linear regression, r values and r-squared values. You must develop your own in class activities but this document contains the "homework."
Subjects:
Grades:
8th - 9th
Types:
CCSS:
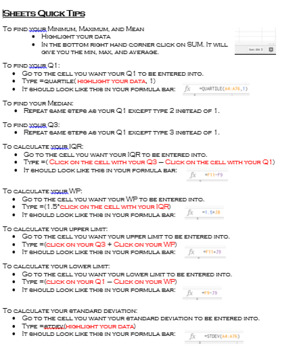
Google Sheets Quick Tips
Here are some quick tips on how to find a five number summary in Google Sheets.
Subjects:
Grades:
Not Grade Specific
Types:
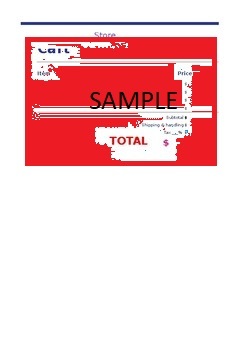
Classroom Cart
Make your students learn about adding money and using tax!
Subjects:
Grades:
4th - 6th
Types:
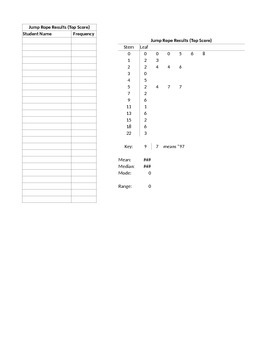
Statistics Project Answer Key and Scoring Rubric
The Statistics Project Answer Key and Scoring Rubric is a supplemental spreadsheet to the Statistics Project Aligned to the 8 Mathematical Practices.
Subjects:
Grades:
6th
Types:
Showing 1-11 of 11 results


