47 results
Free statistics independent works for Google Apps
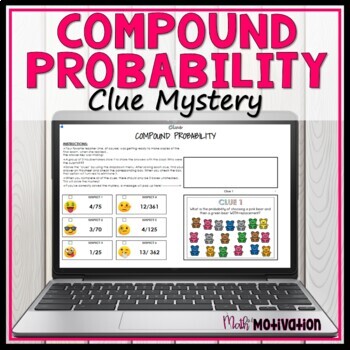
Compound Probability Self Checking Clue Mystery
Engage your middle school math students by using this low-prep, self-checking digital Clue Mystery resource to assess your student's mastery of Compound Probability. As students solve each problem, they will check off the "suspects" for the mystery. Once all of the correct answers are recorded, the mystery will be solved!This activity is perfect for middle school math lesson plans, bell ringers, exit tickets, extra help sessions, early finishers, group/partner work, to send home for extra pract
Subjects:
Grades:
7th - 8th
Types:
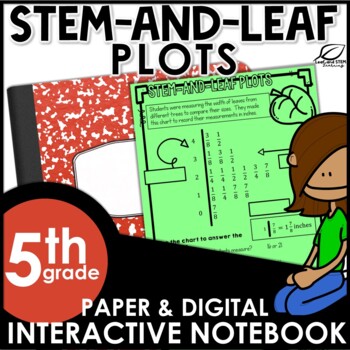
Stem-and-Leaf Plots Interactive Notebook Set | FREE | Distance Learning
Introduce creating and solving one-step and two-step problems using stem and leaf plots. This interactive math notebook set focuses on the Texas TEKS 5.9A and 5.9C. Parts of this set are also appropriate for use with Texas TEKS 4.9A and 4.9B. The stem-and-leaf plots included in this math interactive notebook set use whole numbers, fractions, and decimal values. Also included are a practice activity and a writing activity as well as a 4 question formative test prep style assessment. This fun
Subjects:
Grades:
4th - 6th
Also included in: 5th Grade Math Interactive Notebook - ALL TEKS - ALL CCSS
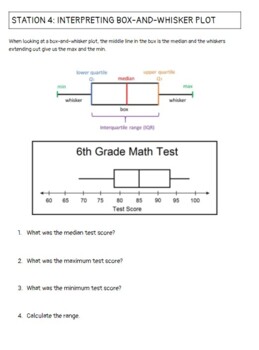
Applied Statistics End of Year Review Stations
A set of 10 stations to help students practice interpreting bar graphs, stem-and-leaf plots, and box-and-whisker plots. Also, works with finding the mean, median, mode, and range. Finally, have probability and normal distribution questions.
Subjects:
Grades:
7th - 12th
Types:
CCSS:
Distance Learning Fraction Line Plot Practice
Digital Learning and trying to teach line plots? This resource provides students with practice creating line plots all using Google Slides. Simply have students make a copy and then they can create line plots for 6 different data sets all with fractions. Students will be able to number the number line and drag 'x' to the correction location. Answer key is included.
Subjects:
Grades:
5th
Types:
CCSS:
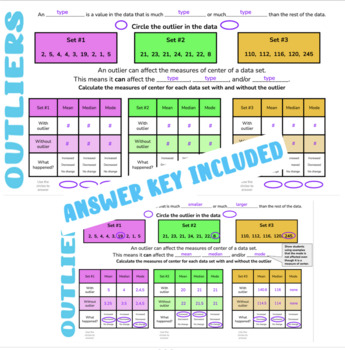
Outliers Google Slides
Try out an activity on me! Students learn how to identify an outlier is in a data set and what it does to the measures of center (mean, median, mode (shows no effect on mode). Includes guided notes and practice problems where students identify measures of center of data with and with and without the outlier. Would make a great introduction or review in any math classroom! Would make a great addition to a digital interactive notebook! Answer key included. Digital learning friendly!
Subjects:
Grades:
6th - 10th
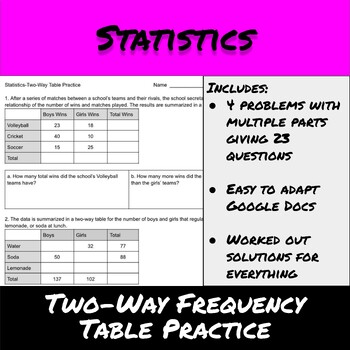
Statistics-Two-Way Frequency Table Practice
This is a review of skills on two-way tables. For this review students should be able to:Read and find values in a two-way frequency tableCreate a two-way table from data and from a storyThis worksheet contains 4 questions with multiple parts giving a total of 23 questions the students have to complete. All graphs are clear and easy to read.Questions too hard or too easy? These are provided as a Google Doc and set up so all questions are easy to adapt for the needs of your students.Want more?CL
Subjects:
Grades:
7th - 9th
Types:
CCSS:
Also included in: 8th Grade Math-Algebra and Pre-Algebra Whole Course Growing Bundle
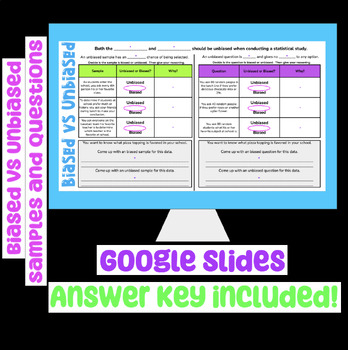
Biased vs Unbiased Samples and Questions Google Slides Digital Notes
Try out an activity for free!Students learn how to identify if a statistical sample and/or question is biased or unbiased. Includes guided notes and practice identifying biased and unbiased samples and questions. Would make a great introduction or review in any math classroom! Would make a great addition to a digital interactive notebook! Answer key included. Digital learning friendly!
Subjects:
Grades:
6th - 9th
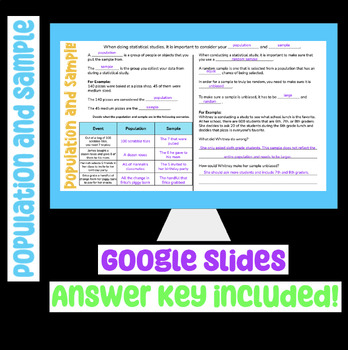
Population and Sample Google Slides Digital Notes
Try out an activity for free!Students learn how to identify the sample and population of a statistical study. Includes guided notes and practice problems where students identify the population and sample, and then use the sample to predict the outcome of the population. Would make a great introduction or review in any math classroom! Would make a great addition to a digital interactive notebook! Answer key included. Digital learning friendly!
Subjects:
Grades:
6th - 9th
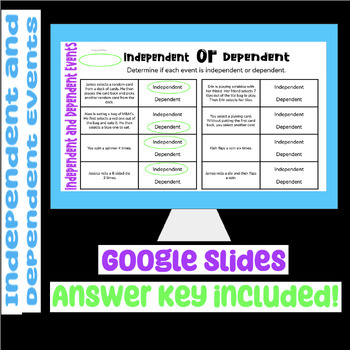
Independent and Dependent Events Google Slides Digital Notes
Try out an activity for free!Students learn how to identify independent and dependent events. Includes guided notes and practice problems where students identify if events are independent or dependent. Would make a great introduction or review in any math classroom! Would make a great addition to a digital interactive notebook! Answer key included. Digital learning friendly!
Subjects:
Grades:
6th - 9th
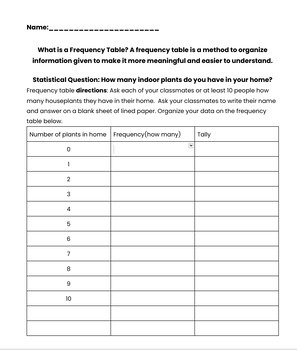
Frequency Table with a Statistical Question
Quickly learn how to organize statistical data with a frequency table. Students are given a statistical question to ask their classmates. Students then organize their data on a frequency table.Students can then create their own statistical question and organize their own data on a frequency table.
Subjects:
Grades:
5th - 6th
Types:

Statistical Questions Matching Activity - PDF & Digital 6SP1
Your students will love identifying Statistical Questions with this fun and engaging cut & paste activity. Cut out each question puzzle piece individually. Then, match it to the corresponding statement (Statistical question or NOT a statistical question). Your download includes a PDF for printing as well as a digital, Google Slides version where students will drag and drop the puzzle piece. Product is viewable in the preview file.Great for:ReviewMath CentersChoice BoardsHomeworkDistance Lear
Subjects:
Grades:
6th - 7th
Types:
CCSS:
Also included in: 6th Grade Statistics Activity Bundle
Statistics: Counting the Community Biblical Integration Lesson
Making authentic connections between Scripture and Math can be challenging. Biblical integration is not just displaying a Bible verse or reading from a devotional, but rather it is demonstrating the correlations between our subject matter and God's perfect design. Hopefully, these lessons will inspire amazing conversations and serve you and your students well.In This Lesson:Students will explore how statistics played a role in biblical times through the example of the census of Israel and discus
Subjects:
Grades:
9th - 12th
Types:
Comprehensive Statistics Worksheet Collection - 8 Units - 34 Worksheets
Enhance your statistics curriculum with this extensive collection of 34 worksheets spanning 8 units. Whether you're a math teacher looking for additional resources or a homeschooling parent seeking comprehensive materials, this worksheet collection provides a wealth of content to support students' understanding of statistics.Unit 1: Introduction to StatisticsWorksheets: 4Description: Introduce students to the fundamentals of statistics, including descriptive vs. inferential statistics, types of
Subjects:
Grades:
9th - 12th, Higher Education, Adult Education

STEM PBL: Probability Bracelets Interactive Notebook Activity
For this activity the students will make simple bracelets out of string and beads. As they create their bracelet they will count the total number of beads they used and how many of each color. As students place information on the chart, they will be able to see the probability of choosing a specific color bead on their bracelet. They will also be able to recognize the percentages of each color being used. This chart can be cut out and pasted into interactive notebooks.
Subjects:
Grades:
3rd - 6th
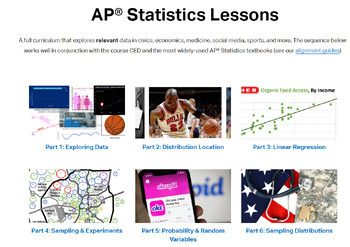
AP Statistics, Full Curriculum, Relevant Topics, ALL FREE - Skew The Script
A free and full AP Statistics curriculum that explores relevant data in civics, economics, medicine, social media, sports, and more. The sequence works well in conjunction with the AP Stats CED and the most widely-used AP Statistics textbooks. Lesson resources include instructional videos, handouts, slide decks, answer keys, and Desmos activities. These flexible materials are perfect for traditional, flipped, or online classrooms. You can find it all (for free) right here: skewthescript.org/ap-s
Subjects:
Grades:
10th - 12th
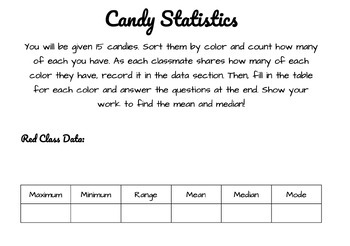
Candy Statistics Activity
In this activity, students are given 15 pieces (or any amount you choose) of colored candy, such as M&M's, Skittles, Jelly Beans, or Starbursts. Data is collected from each class member about how many of each color they have. Then, students are tasked with finding the mean, median, mode, range, maximum, and minimum for each color. Population and sample size are also discussed. Google Doc is editable depending on the colors and quantities of the candy you choose.
Subjects:
Grades:
6th - 8th
Types:
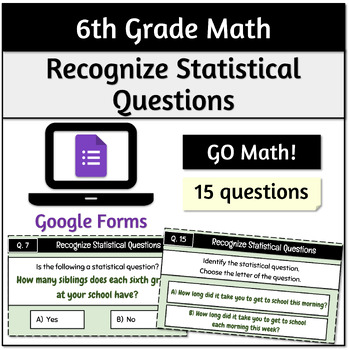
Recognize Statistical Questions | 6th Grade | Self-Grading Google™
This sixth grade digital math resource includes Google Forms with questions on Recognizing Statistical Questions. This self-grading resource can be used as a worksheet to assess your students understanding, and provide them with the practice they need.✅ Recognize Statistical Questions: Recognize a statistical question as one that anticipates variability in the data related to the question and accounts for it in the answers.
Subjects:
Grades:
6th
CCSS:
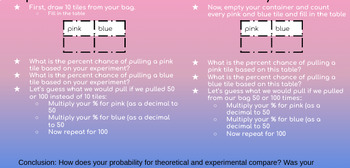
Experimental vs Theoretical Probability (FREE VERSION)
Here is a short little activity that I came up with to help students understand the Law of Large Numbers and the Difference between Experimental and Theoretical Probability. Cut out the pink and blue "tiles" or squares of paper/cardstock. I typically use 15 pink and 20 blue for this activity. The "pink" tiles are for cats and the "blue" tiles are for dogs.
Subjects:
Grades:
11th - 12th
Types:
Math 6 Daily Check-ins: Statistics Bundle
Authentic, quick, and relevant feedback is important for teachers. That information will determine how to progress and pace each lesson. These daily check-ins are designed to be quick comprehension pre-checks or exit tickets. Each form contains a specific topic with the following:Student last name and email (for alphabetizing)3 to 5 short questions; multiple choice, select, or fill in the blankANSWER KEYSettings allow students to answer questions at their own pace, know if an answer is correct o
Subjects:
Grades:
5th - 7th
Types:
Also included in: Math 6 Daily Check-ins: Complete Bundle
Dice Probability
This product is a great introduction to probability that is based on 6th and 7th grade common core math standards. This resource includes an introduction of the difference between experimental and theoretical probability. Students can either work in partners/small groups or individually on completing this experiment. Each group or individual will need their own dice. Students will observe how different factors can create different outcomes when rolling a dice. To analyze their results, students
Subjects:
Grades:
7th
Types:
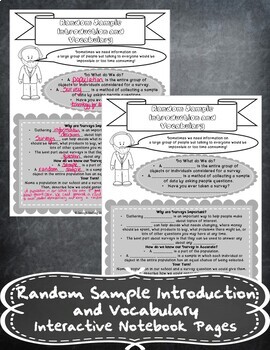
Random Sample Introduction and Vocabulary Notes Handout + Distance Learning
Random Sample Introduction and Vocabulary Notes HandoutTHIS FILE NOW CONTAINS THE PDF VERSION OF THIS PRODUCT PLUS A GOOGLE SLIDES VERSION FOR DISTANCE LEARNINGTHIS PRODUCT IS NOW INCLUDED IN Statistics with Univariate Data - Unit 2 - 8th Grade-Notes + Distance Learning Bundle!This handout covers:- Random Sample Vocabulary- Uses of Random Samples- Real-World Random SamplesThis product includes:- Pictures of the finished foldable in my INB- Link to mp4 Video Notes- Embedded Video Notes in Google
Subjects:
Grades:
7th - 9th
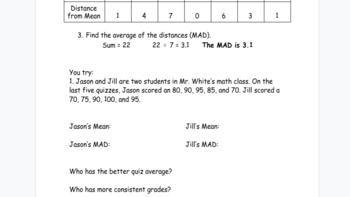
MAD Mean Absolute Deviation
This product includes a video, notes, and a worksheet pertaining to mean absolute deviation for 6th grade students.
Subjects:
Grades:
6th - 7th
Types:
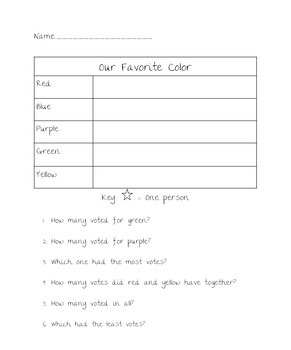
Favorite Color Pictograph
This is a blank "favorite color" pictograph to be filled out as a whole class survey activity with questions to answer at the bottom.
Subjects:
Grades:
K - 3rd
Types:
CCSS:
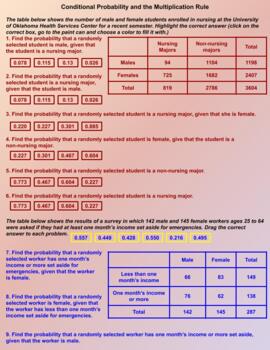
Conditional Probability and the Multiplication Rule
Digital Worksheet on Conditional Probability and the Multiplication Rule.
Subjects:
Grades:
10th - 12th
Types:
Showing 1-24 of 47 results


