237 results
Free statistics resources for Microsoft PowerPoint

Celebrity Birthday Fun Probability Activity for Pre-Algebra and Algebra classes
This 12 minute narrated, animated PowerPoint presentation makes learning the difference between theoretical probability and experimental or empirical probability fun for students. It is intended for 7th, 8th, or 9th grade Algebra classes. It reviews a few Key terms such as probability, event, sample space, etc. and then concentrates on the famous probability birthday problem or paradox in which given a group of 50 people, 97% will share the same birthday.
Three student handouts are included
Subjects:
Grades:
7th - 10th
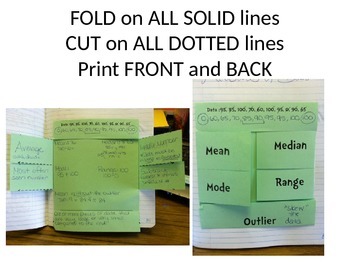
Mean, Median, Mode, Range, Outlier FOLDABLE
This is a download for a one page cut only foldable. Directions are simple, CUT on all dotted lines, FOLD on all solid lines. Gives you 6 flaps to write under with vocabulary on top.
Also includes one set of data to find the mean, median, mode and range (answers included).
This is downloaded in powerpoint, so it can be changed if you do not need the "oulier" topic.
Also, this is an EVEN number of data, so the median will have to be found between 2 numbers: 85 and 90.
This involves deci
Subjects:
Grades:
6th - 8th
Types:
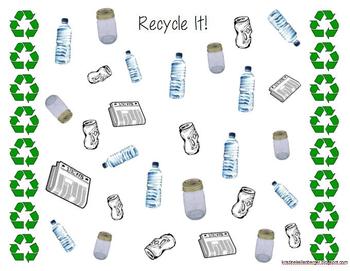
Recycle It! Tally Activity
This is my first worksheet to upload to TPT and I hope you can find it useful!This activity was created to incorporate Earth Day, recycling, and math concepts of tallying and graphing. Use the first page of the various items that we recycle (paper, glass, aluminum, and plastic) as a map to be left at a Math Center. The second page is the students' recording sheet. Students should mark a tally for each item, count the tallies, and then create a graph. There are two versions included, one full col
Subjects:
Grades:
K - 2nd
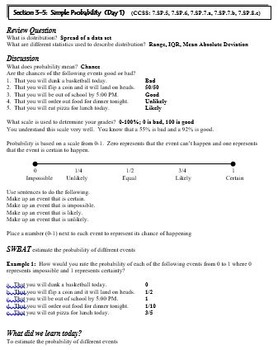
Statistics and Probability: Simple, Theoretical, Experimental, Probability
This is a 7 day lesson plan (powerpoint and hard copy) covering the topics of simple, theoretical, and experimental probability. Each lesson includes a review question, discussion, problems for teacher to model, and problems for the students to try. The lesson plan includes days of instruction, days of practice, assignments, and activities.
Subjects:
Grades:
7th - 9th
Data Analysis and Comparison Review PPT (Graphs)
This is a 24-slide PowerPoint on data analysis and comparison that I use in my 3rd grade classroom as a review before our test. This PowerPoint would also be useful for upper grades to review and activate background knowledge before delving further into data analysis.
It includes 10 vocabulary questions (data, survey, results, frequency table, tally table, pictograph, bar graph, line plot, scale, key). It also includes three slides that contain a bar graph, pictograph and line plot, and contain
Subjects:
Grades:
3rd - 5th
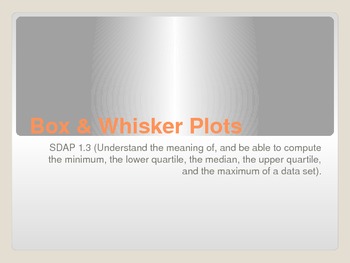
Box and Whisker Plot PowerPoint
This is a PowerPoint presentation on how to use data to make a box-and-whisker plot. It contains step-by-step instructions, tips to reduce common errors, independent and group practice slides, and a partnered kinesthetic activity. Enjoy!
Subjects:
Grades:
5th - 8th
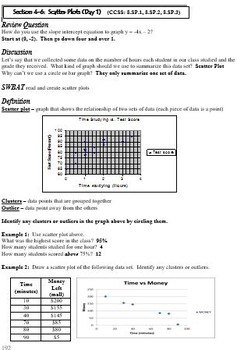
Statistics and Probability: Scatter Plots and Best Fit Lines
This is a 9 day lesson plan (powerpoint and hard copy) covering the topics of scatter plots and best fit lines. Each lesson includes a review question, discussion, problems for teacher to model, and problems for the students to try. The lesson plan includes days of instruction, days of practice, assignments, activities, and a project.
Subjects:
Grades:
7th - 9th
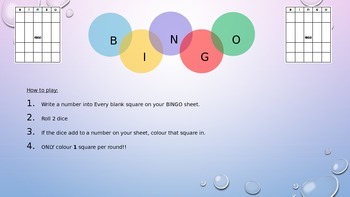
2 Dice Probability Bingo Game
Simple Bingo game where students can use a bingo game as an experiment to discover which values are the highest probability in either the sum of 2 dice or the difference of 2 dice.
Students fill in the sheets with values they think will come up. They get to fill in one square per round if the have a value that matches the sum/difference of the dice. After the first game is played, it should be played again to allow students to use their understanding to improve their chances. Eg. using more
Subjects:
Grades:
5th - 8th
Types:
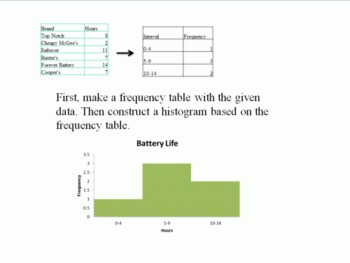
Graphs and Statistics
These five lessons cover the basics about describing sets of data. Topics covered are mean, median, mode and range. There is also information about bar graphs, histograms, line graphs, and circle graphs, as well as line plots and frequency tables. There is also a lesson about misleading graphs and statistics, providing a great opportunity to teach CCSS.Math.Practice.MP3 (Construct viable arguments and critique the reasoning of others.)
This work is licensed under a Creative Commons Attribution-
Subjects:
Grades:
5th - 7th
Intro to Probability, Mean, Median, Mode, and Range
In an effort to make high quality educational material more accessible to parents and teachers alike, regardless of location and/or socioeconomic status, I have decided to post lessons I create on here for FREE. The products I make consist mostly of Google Slides in PDF format for K-8th grade students. They cover a wide range of subject matter, but focus mainly on math and language development. Each lesson is created with the intention of keeping students attentive and actively engaged by using
Subjects:
Grades:
2nd - 4th
Mean, Median, Mode and Range: Who Am I? Test Review Powerpoint
Who Am I? Mean, Median, Mode or Range? Or am I more than one? Let's find out!
This free PowerPoint resource is perfect for a formative assessment at the end of a lesson, or could even be used as an opener with 2 questions per day for a week!
Students will be required to know which measures are of center, which one is of variation and real-life situations where they are used. This is editable as well, so feel free to add on to it!
Subjects:
Grades:
4th - 5th

Celebrity Age Scatter Plot Activity
A fun way to gather data for a scatter plot. Students guess celebrity ages and compare to the real age. Plot data on a scatter plot and analyze the correlation. I have my students do this on large sheets of paper in groups with color-coded stickers at the end of 8th grade. This is updated as of May 2018. Ages (and pics) will need to be updated each year. You will probably want to choose a few different celebrities as mine are specific to people students in a Catholic school in Kansas City would
Subjects:
Grades:
6th - 11th
CCSS:
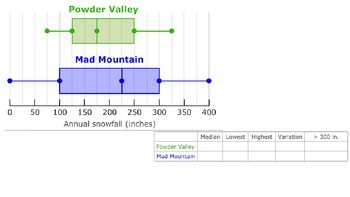
Determining a random sample
This activity, as part of 7.SP.1, provides two levels of difficulty. The lower level cards provide students with a scenario and students must decide if this is an example of a random sample or not. The higher level cards are multiple choice. Students are provided with a scenario and students must select the best response.
Subjects:
Grades:
6th - 8th
Types:
CCSS:
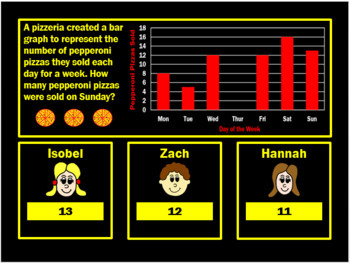
Bar Graphs Powerpoint Game by Arithmetickx
A fun, interactive PPT game to develop children’s knowledge and understanding of bar graphs. This game is suitable for Grade 2 and beyond. All Arithmetickx games incorporate 10 questions which increase in difficulty as the games progress. The games include problem solving and reasoning questions. They are ideal for a 'hook' activity, teaching tool, or assessment tool. All games include a Student Response Sheet.
Subjects:
Grades:
2nd - 5th
Measures of Central Tendency PowerPoint
Here lies a PowerPoint for a quick review of how to choose the most beneficial measure of central tendency and how to calculate a "wanted" or "missing" piece of data when using mean. This makes a good math center, bellwork, or whole class discussion. Sometimes I use it to pre-test; sometimes for a post-test. ENJOY!
Subjects:
Grades:
7th - 9th

Samples and Populations
This lesson will allow students to understand the concept of Samples and Populations. It has the content and videos which will provide students an engaging lesson. It also has links to an online survey that you as the teacher can conduct and control (This will need to be adapted to suit your specific class). Also included is question examples and activities for the students to engage with. The lesson goes through the following topics: samples, populations, surveys, census questionnaires and coll
Subjects:
Grades:
7th - 9th
CCSS:
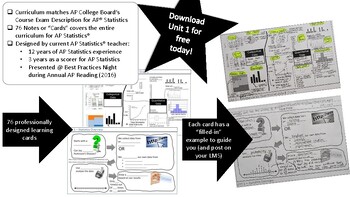
AP Statistics Learning Cards - Unit 1
AP Statistics' Learning Cards for Unit 1 are professionally designed fill-in-the-blank cards that match the AP Statistics Course Description6 cards in unit 1Word documents provide 2 different formats to present to studentsPowerPoint presentation fileAll documents are editable
Subjects:
Grades:
9th - 12th
Probability and Tree Diagrams
This PowerPoint can be used as a resource on how to draw Tree Diagrams. It goes through drawing out Tree Diagrams step by step and has many questions that can be used to solve as a class
Subjects:
Grades:
7th
Types:

Mean (Average) PowerPoint by Kelly Katz
Check out the free preview! Complete lesson for teaching students how to calculate the mean of a given data set.
Objective: We will calculate the mean of a given data set.
PowerPoint includes objective, language objective, vocabulary, steps for calculating the mean (great note-taking slide for students), and plenty of examples for student practice. Includes test-prep multiple choice questions. This is a great lesson to use with student whiteboards. I project PowerPoint directly onto my whiteboa
Subjects:
Grades:
4th - 6th
Types:
Misleading data displays
This PPT is suitable for Data Representation and Interpretation -Interpret secondary data presented in digital media and elsewhere (ACMSP148) Identify potentially misleading data representations in the media, such as graphs with broken axes or non-linear scales, graphics not drawn to scale, data not related to the population about which the claims are made, and pie charts in which the whole pie does not represent the entire population about which the claims are made investigating data represent
Subjects:
Grades:
6th - 8th
Types:
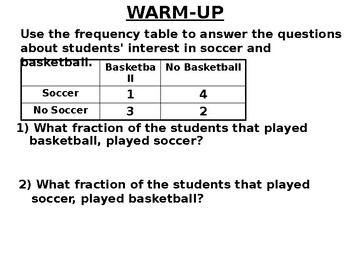
Math 8 19.6 Find the Relative Frequencies of the Data
This editable lesson was written by Alex Benn using the concepts described in his book Tenacious-Teaching: Uniting Our Superpowers to Save Our Classrooms and his website: Tenacious-Teaching.com. It includes an introductory warm-up designed to remediate the required prerequisite knowledge; concise notes; tasks that require escalating effort; numerous examples to prevent misconceptions; and in-class practice problems to promote mastery. It does not include answers to the tasks provided. Those are
Subjects:
Grades:
7th - 9th
Types:
Also included in: Math 8 Unit 19 Fractions, Percents, and Statistics
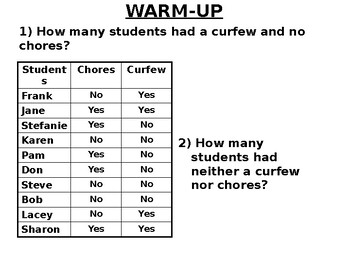
Math 8 19.1 Put Data into Venn Diagrams and Frequency Tables
This editable lesson was written by Alex Benn using the concepts described in his book Tenacious-Teaching: Uniting Our Superpowers to Save Our Classrooms and his website: Tenacious-Teaching.com. It includes an introductory warm-up designed to remediate the required prerequisite knowledge; concise notes; tasks that require escalating effort; numerous examples to prevent misconceptions; and in-class practice problems to promote mastery. It does not include answers to the tasks provided. Those are
Subjects:
Grades:
7th - 9th
Types:
Also included in: Math 8 Unit 19 Fractions, Percents, and Statistics
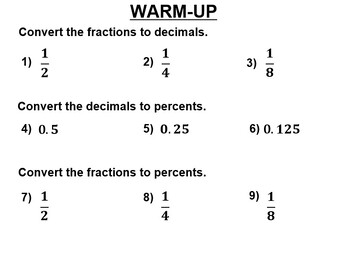
Math 8 19.3 Fractions to Decimals to Percents
This editable lesson was written by Alex Benn using the concepts described in his book Tenacious-Teaching: Uniting Our Superpowers to Save Our Classrooms and his website: Tenacious-Teaching.com. It includes an introductory warm-up designed to remediate the required prerequisite knowledge; concise notes; tasks that require escalating effort; numerous examples to prevent misconceptions; and in-class practice problems to promote mastery. It does not include answers to the tasks provided. Those are
Subjects:
Grades:
7th - 9th
Types:
Also included in: Math 8 Unit 19 Fractions, Percents, and Statistics
Showing 1-24 of 237 results


