13 results
Free statistics independent work images

Histogram Pop Quiz
Histogram activity for standard:MGSE6.SP.4 Display numerical data in plots on a number line, including dot plots, histograms, and box plots.
Subjects:
Grades:
5th - 7th
Types:
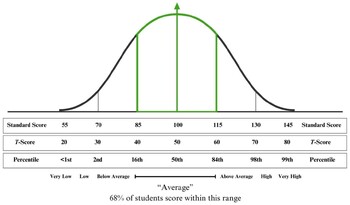
Bell Curve Diagram, Standard Scores, T-Scores, Percentiles
This bell curve diagram helps to illustrate standard scores, T-scores, percentiles, and qualitative descriptors. Print and bring to meetings to explain scores to team members, or include directly in your psychoeducational reports.
Subjects:
Grades:
Not Grade Specific
Types:

Statistics Survey Project
These are student instructions for a survey and data project. Students need to collect, record, analyze, and display data.
Subjects:
Grades:
4th - 8th
Types:
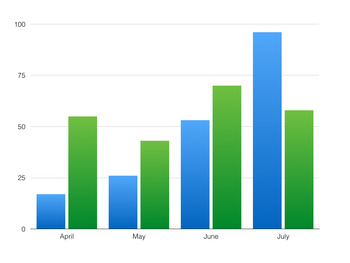
Math- Bar Graph Statistics
This product includes a bar graph with the favorite pets of the 6th and 7th graders at a school, along with 5 corresponding questions to the graph.
Subjects:
Grades:
5th - 7th
Types:
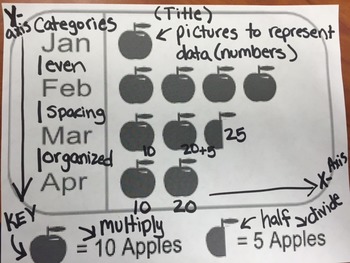
Pictographs Anchor Chart
Pictographs Anchor Chart
TEKS 2.10 B- The student will organize a collection of data with up to 4 categories using pictographs and bar graphs with intervals of one or more
TEK 2.10 C-The student will write and solve one step word problems involving addition or subtraction using data represented within pictographs and bar graphs with intervals of one
Subjects:
Grades:
1st - 4th
Types:
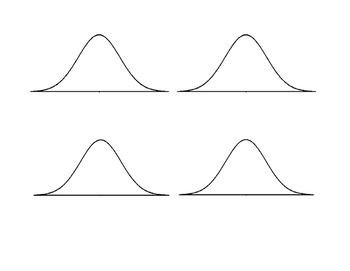
Blank Normal Curves
Four normal curves in a landscape MS Word document. Can be copied and pasted to PowerPoint. Click and drag a corner to resize. Click and drag an edge to change depiction of variance.
Subjects:
Grades:
9th - 12th, Higher Education, Adult Education
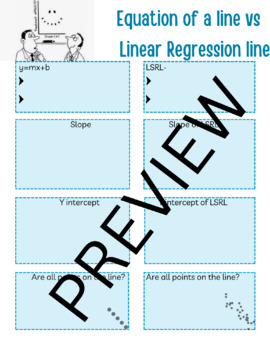
Equation of a Straight Line VS Linear Regression Line.
Equation of a Straight Line VS Linear Regression Line.Quick and easy way to make connections with what students know about a straight line and this new concept (Linear Regression)
Subjects:
Grades:
11th
CCSS:

Do My Classes For Me
Worried because of your online classes? Stop worrying and simply ask us to do my class online for me. Our professional experts are waiting anxiously to help you with any of the classes you want. Feel free to contact us anytime you want as we are available 24/7 for you. Visit: https://domyclassesforme.com/
Subjects:
Grades:
Higher Education, Staff
Types:

Do My Exam Now
Do my exam now highly qualified staff provides you with academic support related to your assignments, quizzes, and exams to ensure that you'll achieve good grades. Looking for a tutor who is an expert in your subject? You can count on our academic writers to help you whenever you are stuck on an assignment.
Subjects:
Grades:
9th - 12th, Higher Education, Adult Education
Types:
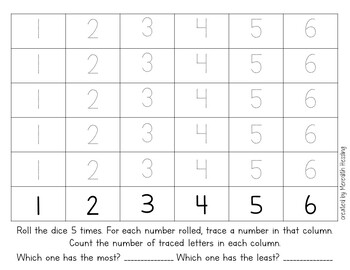
Dice Roll Graphing Exercise
Use this printable worksheet in your classroom to expand on number odds, statistics, and graphing.
Subjects:
Grades:
Not Grade Specific
Types:
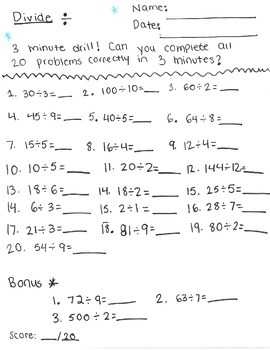
Division Drill
Have your students beat the time clock! Complete 20 division problems in three minutes!
Subjects:
Grades:
2nd
Types:
CCSS:
Showing 1-13 of 13 results


