36 results
Free statistics independent works for Easel
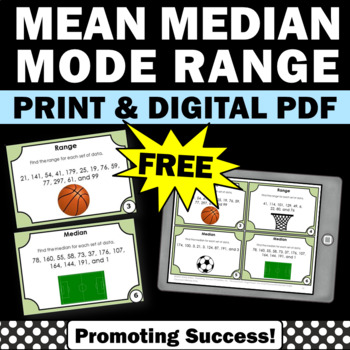
FREE Statistics and Probability Mean Median Mode Range Task Cards 5th 6th Grade
DIGITAL PDF AND PRINTABLES: You will download six free mean, median, mode and range task cards for your 5th or 6th grade students to practice finding the mean, median, mode and range. You may use the printable task cards in math centers or stations for fun review games and activities, such as a scavenger hunt or SCOOT. They also work well for transition activities, as exit tickets and for morning work, quick formative assessments. Game ideas, a student response form and answer key are included.✔
Subjects:
Grades:
5th - 6th
Types:
CCSS:
Summer Statistics - tally & bar charts.
Summer themed tally and bar chart activities. - 2 worksheet tasks with answers (8 pages). - 1 worksheet activity giving students an opportunity to carry out a survey in class and collecting/presenting results in a tally table and bar chart (2 pages).Digital Activity Available:The tally chart worksheets included in this resource would be fine to use as a digital activity. Instructions and answer boxes have been added to these pages. However, the bar charts would currently still be better to use i
Subjects:
Grades:
3rd - 5th
Types:
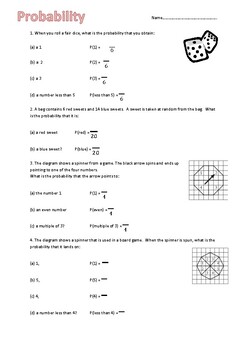
FREEBIE! - Scaffolded basic probability worksheet
This worksheet is perfect for low ability, SEN and struggling students to help support them in finding basic probabilities. The worksheet has fractions included and students have to fill in the missing spaces. A good supporting worksheet for an intro into probability. Answer key included.
Subjects:
Grades:
7th - 9th
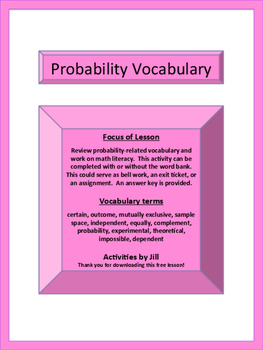
Probability Terms Worksheet with Word Bank (Distance Learning)
Focus of LessonReview probability-related vocabulary and work on math literacy. This activity can be completed with or without the word bank. This could serve as bell work, an exit ticket, a math center, or an assignment.Vocabulary termscertain, outcome, mutually exclusive, sample space, independent, equally, complement, probability, experimental, theoretical, impossible, dependentUse this note-taking product to introduce the vocabulary terms!Probability Vocabulary NotesCCSS 7.SPProbability Te
Subjects:
Grades:
6th - 9th
Types:
Box and Whisker Plot
Students will be able to understand how to create and draw box and whisker plot diagrams through an activity that is student-centered and visual with some teacher-direction.This activity can be adapted for other data* rather than just heights of the students. *You can use height, how far a student can jump all starting at the same line, or even how far to throw a cotton ball -the examples are endless.This activity goes great with the comparison activity (this also has a color-coded answer key) -
Subjects:
Grades:
6th - 8th
Types:
CCSS:
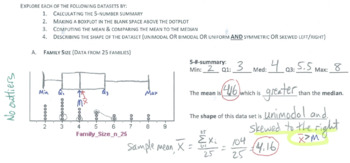
Statistics and Data Analysis: 5-number summary, box plots, and outliers
An introduction to data analysis, this 2-page handout (with answer KEY!) provides 6 datasets to analyze. Students compute the 5-number summary, make a box plot, describe the shape of a data set and relate the shape to the mean/median relationship, then finally go back through and check for outliers.
Subjects:
Grades:
9th - 12th
Types:
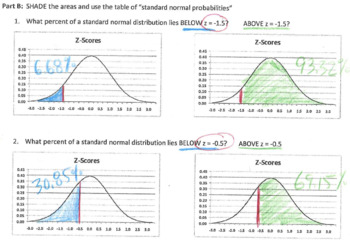
Statistics sketches: Z-scores and percentiles
Students will make a connection between z-scores and percentiles by shading the area under a bell curve (actually, 10 areas under 10 bell curves!). Finally, students will create a box plot under a standard normal distribution in order to make a strong connection between the unimodal symmetric normal distribution and its box plot.
Subjects:
Grades:
9th - 12th
Types:
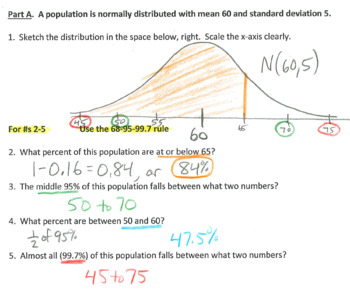
Statistics Quiz: the normal distribution
One practice quiz (with answer KEY!) and two forms of a "real quiz" (answer KEYs provided!) on the normal distribution. Students must sketch and label a bell curve, use the 68-95-99.7 rule, compute z-scores and use a z-table (commonly referred to as "Table A").
Subjects:
Grades:
9th - 12th
Types:
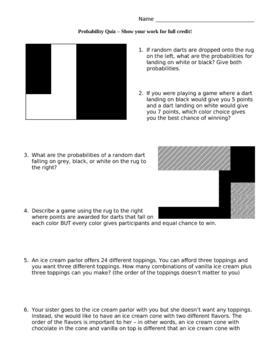
Probability Quiz - random probability, permutations & combinations
This is a ten question quiz that could also be used as a worksheet that covers random probability, permutations, and combinations. The preview file is a pdf of five of the questions. Answer key is included.
Subjects:
Grades:
8th - 10th
Types:
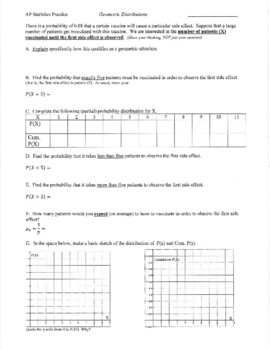
Statistics practice: Geometric and Binomial Probability distributions
In the context of a side effect from a vaccine, students practice the concepts and computations of the geometric and binomial probability distribution in this two-page handout with answer KEY provided!
Subjects:
Grades:
9th - 12th
Types:
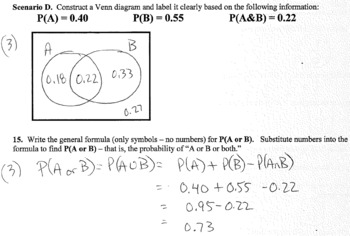
Statistics Quiz: Basic Probability (two versions)
Two versions of a quiz on basic probability concepts (answer KEYS provided). One quiz could be used as a practice/review. Includes sample space, independent events, mutually exclusive events, Venn diagrams, and the complement rule.
Subjects:
Grades:
9th - 12th
Types:
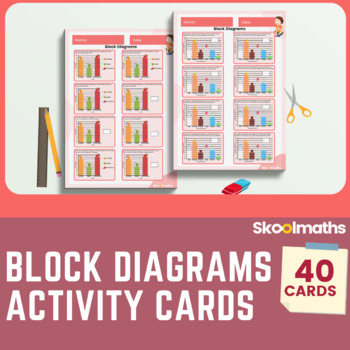
Bar Graph Activity Cards + Answer Key
Bar Graph Activity Cards + Answer Key #dollardealsAre you looking for a mix of no-prep bar graphs activities? This resource includes bar graph flashcards, worksheets, graphing questions, class graphs. Your students will be reading graphs and analyzing data in no time!This amazing collection of 40 colorful Bar Graph Activity Cards will provide extra engaging activities for your first-grade learners. Buy this great value bundle today to save you hours of planning and don't forget to leave an hones
Subjects:
Grades:
1st
CCSS:
Also included in: First Grade Math Bundle Interactive Lessons, Activities and Worksheets
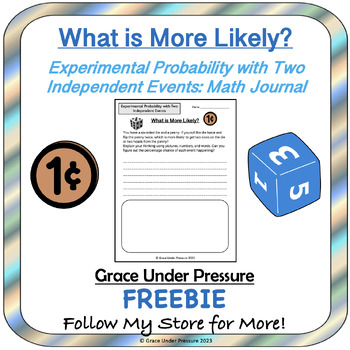
Experimental Probability with Two Independent Events: Math Journal FREEBIE
Here's a quick math journal entry for your middle school probability unit. Give your students six-sided dice, pennies, and whiteboards and let them explore what happens when they flip the coins and roll the dice. They can practice finding the experimental probability.Teach a mini lesson about the theoretical probability of two independent events: that you multiply the probability of each event to find the probability of BOTH events.Next, students are ready to work on the journal prompt. Expect a
Subjects:
Grades:
6th - 9th
Types:
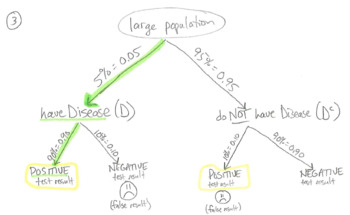
Probability Practice Packet (5 parts)
5-part probability practice packet (with answer KEY!). Students will practice the "rules and tools" of probability, to include the sample space, Venn diagrams, substitution into formulas, two-way tables, conditional probability, and tree diagrams.
Subjects:
Grades:
9th - 12th
Types:
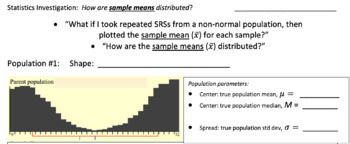
Statistics Investigation: the Central Limit Theorem:
This activity guides students as they investigate the wonderful website https://onlinestatbook.com/stat_sim/sampling_dist/. Through their observations, students can visualize the powerful and important fact known as the Central Limit Theorem (CLT).
Subjects:
Grades:
11th - 12th
Types:
Build the Skill - Measures of Central Tendency
These activities correspond with the Measures of Central Tendency video playlist on our YouTube Channel (https://bit.ly/2LABfvU).Measures of central tendency attempt to describe a set of data by identifying a single value within a given set of numbers.Videos can be accessed via the QR code on each page. All answers are in the corresponding video, so you could use this as a self-guided activity.
Subjects:
Grades:
4th - 8th
Pie Chart Notes Descriptive statistics AP Statistics
Guided notes for pie charts. This is Unit 1: lesson 3a in the AP Statistics Curriculum.Included in this resource:Interactive notebook pages Guided notesPractice ("try it") pages for individual or partner workNotesAnswer keyTopics included:Construct a pie chartInterpret a pie chartThis resource can be found in the following bundles:AP Statistics CurriculumAP Statistics Unit 1AP Statistics Unit 1 Notes OnlyGet students ready for the AP Statistics exam with the full curriculum. Questions? Leave y
Subjects:
Grades:
9th - 12th
CCSS:
Also included in: Descriptive Statistics AP Statistics
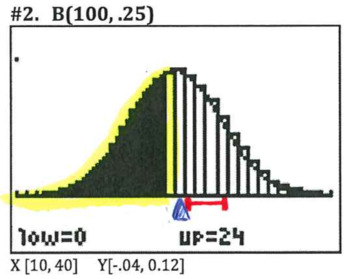
Statistics practice: Binomial Distributions & the Normal Distribution
Students will work through several binomial distributions in order to recognize when the binomial distribution can be approximated by the normal distribution. Examples and answer key include graphs to provide visual support.
Subjects:
Grades:
9th - 12th
Types:
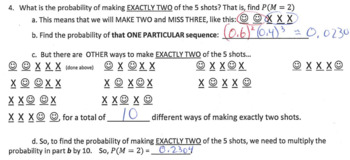
Statistics notes: Intro to the Binomial Distribution (w/practice problems)
Lead students through a clear, visually reinforced example to introduce the binomial formula, then practice solving problems using the binomial distribution. Answer KEY included.
Subjects:
Grades:
9th - 12th
Types:
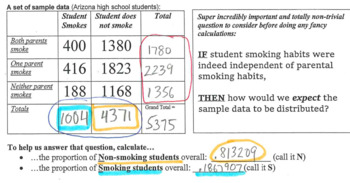
Statistics practice: chi-square test of independence
In the context of parent/student smoking habits, students practice the chi-square test of independence for a two-way table. Includes answer KEY.
Subjects:
Grades:
9th - 12th, Higher Education
Types:
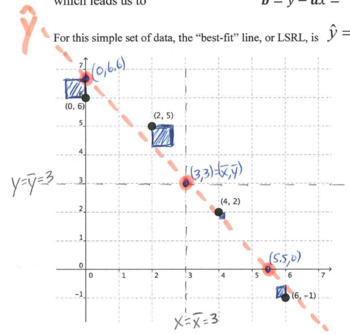
Statistics Lesson: Introduction to Correlation and Linear Regression
Guided notes for introducing correlation and linear regression, students will be actively engaged in the calculations and the visualization of the "least-squares regression line" (LSRL).
Subjects:
Grades:
10th - 12th
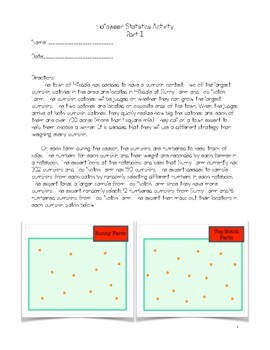
Halloween Statistics Activity Standard Deviation and T-Test
Halloween Statistics Activity for calculating mean and standard deviation. Product includes worksheet (13 pages) and answer sheets. This includes practice for calculating the mean and the standard deviation by hand for two samples. This is the updated full resource that also includes practice for calculating a Student's T-test.
Subjects:
Grades:
8th - 12th
Types:
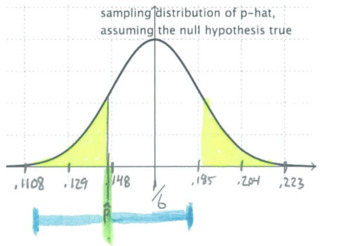
Statistics practice: Connecting significance tests and confidence intervals
Students work through inference about proportions in order to make a connection between the results of a significance test and the confidence interval. Rather than just telling students the relationship, this activity shows them! Answer KEY provided.
Subjects:
Grades:
11th - 12th
Types:
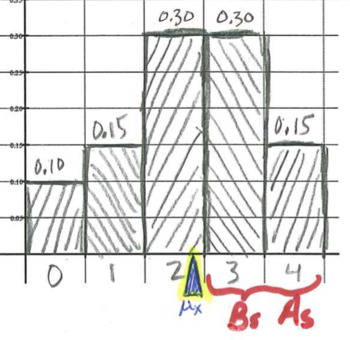
Statistics practice: Random Variables
Students work through the computation of the mean and variance of discrete random variables with reference to the probability histograms. After introductory examples, students work through several practice problems. Answer KEY provided!
Subjects:
Grades:
9th - 12th
Types:
Showing 1-24 of 36 results


