278 results
Free statistics handouts
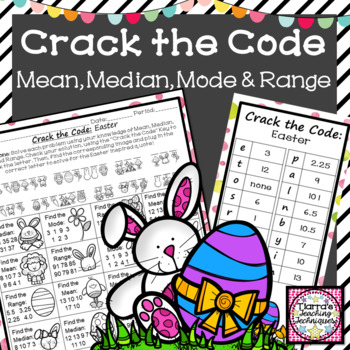
Crack the Code Mean Median Mode and Range Activity
This Easter FREEBIE is the perfect activity to supplement your lesson on Mean, Median, Mode and Range! This Measure of Central Tendency activity includes 16 Problems with an additional Challenge Question for your fast finishers. Students will solve each problem then use the "Crack the Code" Key to match an image with a letter in order to solve for an Easter inspired quote. Use as a whole group activity, small group even centers! Great component to academic practice (homework) and checking for
Subjects:
Grades:
5th - 6th
Types:
CCSS:
Also included in: Holiday Math Worksheets Crack the Code Growing Bundle
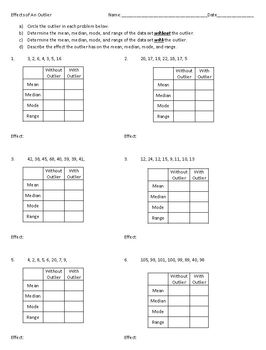
Effects of an Outlier on Mean, Median, Mode, and Range
This worksheet helps reinforce the effect of an outlier on the mean, median, mode, and range of a data set. Six data sets are provided. Students must calculate the mean, median, mode, and range of each data set with the outlier included, then with the outlier excluded. They must then determine what effect the outlier has on these statistics when included in the data set. A complete answer key is also provided.
Subjects:
Grades:
6th - 9th
Types:
FREE Activity!! Histograms - 6th Grade Math - Statistics
This resource is a 3-page student handout on interpreting and describing information found in histograms.
The answer key is shown in the thumbnails above.
This activity is one of the activities in a 6th grade resource on statistics and probability. See this bundle by clicking below.
Common Core Math 6th Grade - Statistics and Probability - CCSS 6.SP
Enjoy using the FREE activity!!
Additional 6th grade resources are listed below.
Math Board Games Bundle - 6th Grade - (6.RP) (6.NS) (6.EE) (6
Subjects:
Grades:
6th
Types:
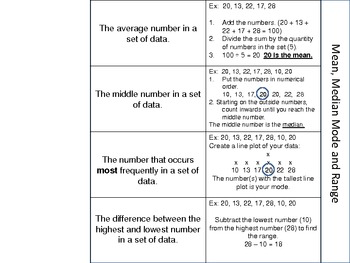
Mean, Median, Mode & Range Math Foldable
You can use this foldable to introduce mean, median, mode and range. Students can easily paste it into their notebooks or file it away in a math folder!
Subjects:
Grades:
4th - 6th
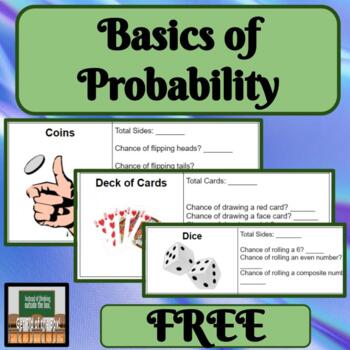
Basics of Probability Dice Cards Coins
About this Resource:Many students do not know all that is needed about dice, coins, and decks of cards. In order to be successful, it is important to cover all of this information first. Topic Covered:*Probability Ways to use this product in your classroom:-whole class-exploration-hands-on-small group-independent Other products with similar content.M&M's ProbabilityBox Plots with WeatherVisuals with Measures of Central TendencyCreating Line Plots
Subjects:
Grades:
6th - 9th
Types:
Also included in: Probability Bundle Hands On Dice Cards Coins Simple Probability
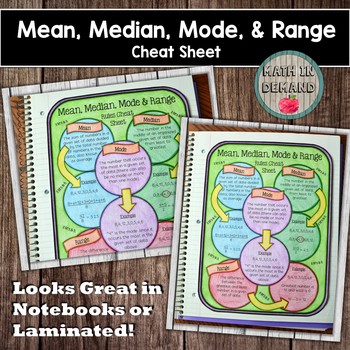
Mean, Median, Mode, and Range Cheat Sheet
Included is a cheat sheet on mean, median, mode, and range. You can have students place the cheat sheet in their interactive notebooks, or you can laminate the cheat sheet and use it year after year!
Subjects:
Grades:
6th - 8th
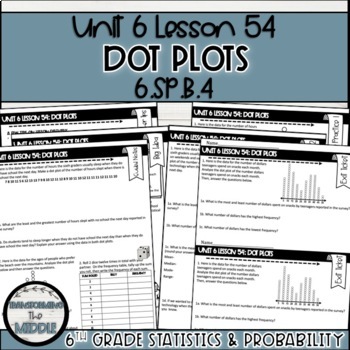
Freebie Dot Plots Lesson | 6th Grade Math
This Dot PLots lesson is a free, fully aligned lesson for 6th grade Math Common Core standards 6.SP.B.4 and 6.SP.B.5. In this lesson, students will learn how to read a data set to create a dot plot. Students will learn how to display the data, analyze it, and make observations about the data set. About This Product:-PDF printable-14 page printable lesson includes:1 teacher overview/product page1 lesson notes page that explains the standards and flow of the lesson1 teacher tips page that explains
Subjects:
Grades:
6th
Types:
Probability Practice Galore!
A great resource for teaching Probability! These two mini-booklets contain large images to use for word study or as anchor charts, two worksheets involving spinners and probability lines, and extra probability worksheets. It's likely that these will come in handy!
Subjects:
Grades:
3rd - 6th
Types:
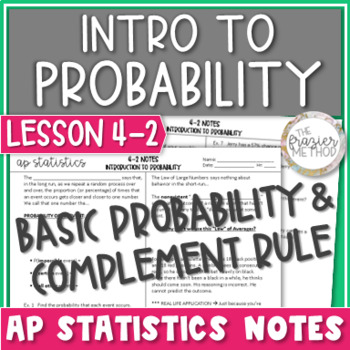
AP Statistics Notes Intro to Probability Basic Probability & Complement Rule
AP Statistics notes on BASIC PROBABILITY & COMPLEMENT RULE for FREE!!! Define and calculate the probability of a single event, the probability of the event’s complement, and the probability assignment rule as it applies to sample space. Also included is the Law of Large Numbers.Aligns with AP College Board's objectives and standards for AP Statistics Unit 4: Probabilities, Random Variables, & Probability Models. WHAT’S INCLUDED IN THIS PRODUCT?Lesson 4-2: Probability Rules Part 1 – Intro
Subjects:
Grades:
10th - 12th
Also included in: AP Statistics Notes Unit 4 Bundle - Probability Rules & Random Variables
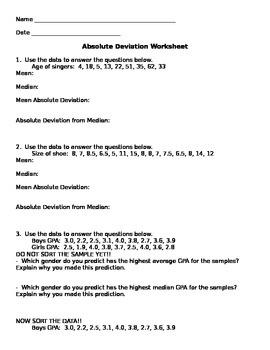
Mean Absolute Deviation Worksheet
Students will practice finding measures of central tendency and then calculate the mean absolute deviation as well as the absolute deviation from the median.
Subjects:
Grades:
6th - 10th
Types:
CCSS:
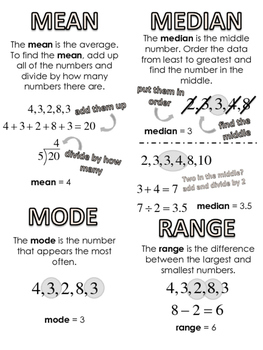
Measures of Central Tendency bookmark/ reference page
Here is a reference sheet for students to remember what mean, median, mode and range are and provides examples of how to find them.
Print this document two sided and cut in half to create two bookmarks with definitions and examples of mean, median, mode, and range. You can also hole punch it so students can keep it in their binders.You can also print the page and hole punch it as a full sheet.
Subjects:
Grades:
5th - 8th
Centimeter & 1 Inch Grid Papers (Full Sheets Each)
A full sheet of Centimeter Grid Paper and a full sheet of 1 inch Grid Paper all contained in one easy to transport/store .pdf. You can use these sheets with making charts, plotting points, etc... Enjoy and thank you for your support.
Subjects:
Grades:
PreK - 12th, Higher Education, Adult Education, Staff
Types:
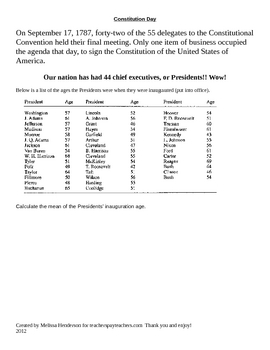
Constitution Day - Math activity
Constitution Day. It is a law that all teachers must teacher the constitution on this day regardless of the content. I developed this activity for my 6th grade students to complete on constitution day. This would also be a great cross curriculum item as well!
Subjects:
Grades:
5th - 7th
Types:
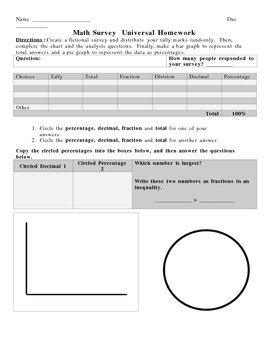
Take A Survey -- Learn Fractions, Percents and Decimals
This is a project that helps students learn to compute fractions, decimals and percents. The preview is a "universal" homework that students can complete for review any time during the year.
Take A Survey -- Learn Fractions, Percents and Decimals by Sherre Vernon is licensed under a Creative Commons Attribution-Share Alike 3.0 United States License.
Subjects:
Grades:
6th - 12th, Higher Education, Adult Education
7th Grade Common Core Probability and Statistics Unit
Probability and Statistics Unit for 7th Grade Math Common Core
Lessons include:
Mean, Median, Mode, and Range
When to Use Each Measure
Mean Absolute Deviation - How to Calculate
Mean Absolute Deviation - Analysis
Sampling and Biased Surveys
Making Predictions from Survey Results
Simple Probability (Single Event)
Compound Probability - Independent Events
Compound Probability - Dependent Events
Subjects:
Grades:
6th - 8th
FREEBIE Probability Vocabulary and Formula Study Sheets (Common Core Aligned)
These probability study sheets provide a quick way for students to review essential vocabulary and formulas, including probability rules, as part of a high school probability unit. Probability Study Sheets include vocabulary and formulas on the following topics:Sample spaces; outcomes; events; two-way frequency table; conditional probability; union; intersection; complement; two-way frequency table; independent events; Venn diagrams; addition rule; complement; probability rules; complement rule;
Subjects:
Grades:
9th - 12th
Types:
CCSS:
Also included in: Bundle: Probability Unit Curriculum (Common Core)
Worksheet on Two-Way Tables with Answers
A quick worksheet on two-way tables, including filling one in from given data, finishing a part-completed table and a question which is easiest with a two-way table but without mentioning it. Hope you like it.
Subjects:
Grades:
7th - 11th
Types:
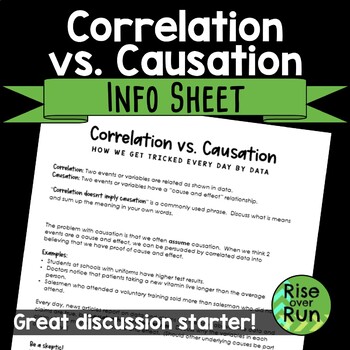
Correlation vs. Causation Information Sheet Freebie
Help students distinguish between causation and correlation. This info sheet give definitions and examples of correlation that are often called causation. It is a great way to start discussions and get students thinking. The page explains why causation is difficult to prove and how a study would need to have a control group. Students are prompted to look for real articles and point out correlation being used to imply causation (which happens a lot)!
Subjects:
Grades:
8th - 11th
Types:
CCSS:
Also included in: 8th Grade Math Activities & Lessons Bundle for the Whole Year
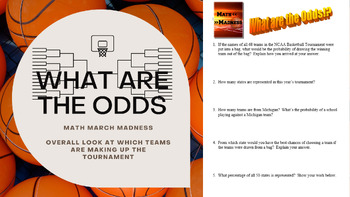
Math March Madness - What are the Odds!? (Overall Stats of Tournament Make Up)
Math + March Madness = Golden Learning Opportunities! Refocus those off topic conversations about march madness that come into the classroom into productive discussions from the math perspective! Students will be excited to work with this authentic, real world math application of probability and statistics. This assignment can be used after tourney teams are announced, but before all the action begins to research stats on teams that will be competing as well as answer a few probability questi
Subjects:
Grades:
6th - 12th, Higher Education
Types:
CCSS:
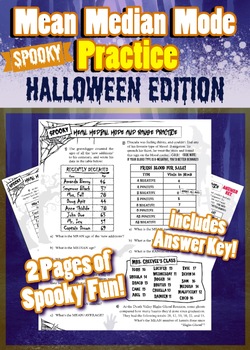
Halloween Mean Median Mode Range Practice - Spooky and Fun Math Handout
Spooky and FUN Mean Median Mode Range Practice - Halloween Printable ActivityEven your most ghoulish students will love this handout! It's full of hilarious scenarios and monster names, and includes lots of spooky fonts and icons. Your students will be so entertained by this printable, that they'll forget they're improving their math skills while using it.Since each problem on the handout is a multi-part problem, this handout features over 25 chances for students to improve their statistical ana
Subjects:
Grades:
4th - 9th, Adult Education
Types:
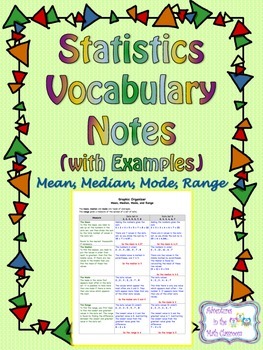
Statistics Vocabulary Notes - Mean, Median, Mode, Range
These color-coded vocabulary notes help students find the mean, median, mode, and range of a data set through example. There are two sets of data that are used to show students the different possible outcomes when it comes to finding the mean, median, mode, and range of a data set.
Subjects:
Grades:
4th - 9th
Types:
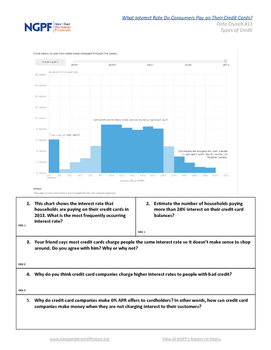
What Interest Rate Do Consumers Pay On Credit Cards?
Using data supplied by National Public Radio (NPR), students can see the wide variation in interest rates that consumers pay on their credit cards. A good discussion starter about the importance of a good credit score and how to think about those 0% APR credit card offers. NGPF Data Crunches (cli.re/ngpf-data-crunch) teach your students key personal finance concepts while also honing their analytical skills.
Subjects:
Grades:
9th - 12th
Types:
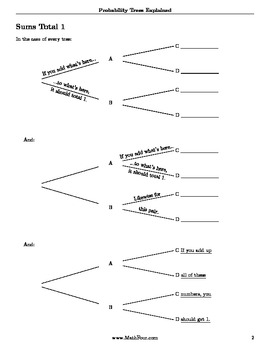
Probability Trees Explained
Using probability tree diagrams to teach probability is helpful - but sometimes kids (and grownups) need a little help with them.
This "cheat sheet" has 5 pages of detailed (and easy to understand) explanations on how to calculate the various probabilities - including conditional probabilities.
Once students understand how probability trees work, they can effectively use them as tools.
Make sure you also download my Probability Trees Puzzles free worksheet, too!
And for more information, se
Subjects:
Grades:
9th - 12th, Adult Education
Types:
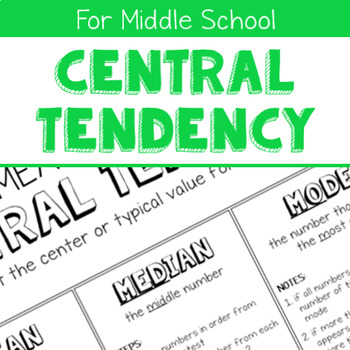
Measures of Central Tendency Notes Handout
This page of notes describes the three main measures of central tendency (mean, median, and mode), providing a definition as well as the steps for finding each measure.
Subjects:
Grades:
5th - 8th
Types:
Showing 1-24 of 278 results


