54 results
Free statistics study guides
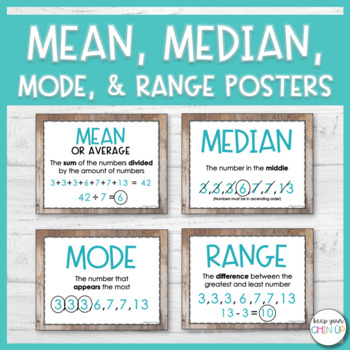
Mean, Median, Mode, and Range Posters
Looking for a visual to help your students with determining the mean, median, mode, and range of a data set? These simple posters are designed to help your students remember key words and formulas for each of the terms.
WHAT'S INCLUDED?
► 2 Options for printing (color or black & white)
► Posters for the terms: mean, median, mode, range, and data set
► Vocabulary worksheet
► Practice worksheet
Subjects:
Grades:
4th - 6th
Types:
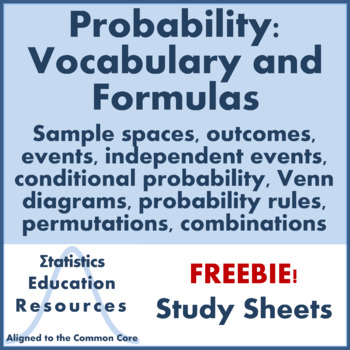
FREEBIE Probability Vocabulary and Formula Study Sheets (Common Core Aligned)
These probability study sheets provide a quick way for students to review essential vocabulary and formulas, including probability rules, as part of a high school probability unit. Probability Study Sheets include vocabulary and formulas on the following topics:Sample spaces; outcomes; events; two-way frequency table; conditional probability; union; intersection; complement; two-way frequency table; independent events; Venn diagrams; addition rule; complement; probability rules; complement rule;
Subjects:
Grades:
9th - 12th
Types:
CCSS:
Also included in: Bundle: Probability Unit Curriculum (Common Core)
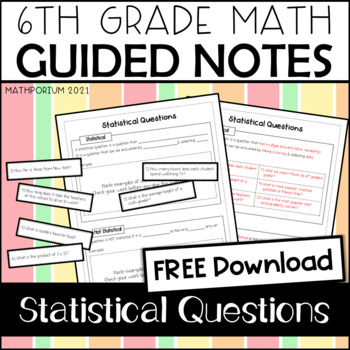
FREE Statistical Questions Guided Notes
This interactive guided notes page is a great resource for teaching statistical questions. You can print them for students to have as reference, upload to your class page, or even create a math reference board in your classroom. The pages are perforated to fit into a spiral notebook.If you like this product, check out the complete collection of Statistics Guided Notes which includes 12 sets of notes and answer keys, all aligned to 6th grade Common Core standards.You might also like:Statistics Gu
Subjects:
Grades:
6th
CCSS:
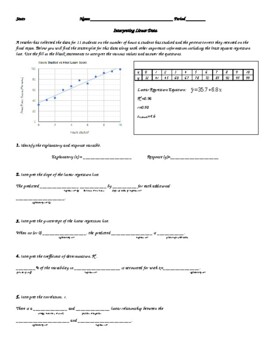
Statistics: Interpreting Linear Data Worksheet
Students will use the information given in the scenario of Hours Studied vs Final Exam Score to interpret statistical measures like correlation, coefficient of determination, the standard deviation of residuals, residuals, and slope and y-intercept of the least-squares regression line. They will use the fill-in-the-blank models to help them interpret these measures. Editable worksheet.
Subjects:
Grades:
9th - 12th
Types:
CCSS:
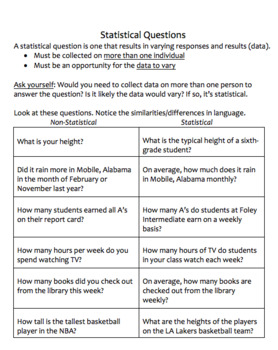
Statistical Questions Study Guide
Do your students struggle with the concept of statistical questions? They can be tricky because subtle nuances in language have a huge impact on whether questions are statistical or not. I created this product to help my ELLs understand the similarities and differences between the two question types. This one-page study guide gives examples of S/NS questions which deal with the same subject matter and data, but use different vocabulary so that students can compare and discuss them. Enjoy.
Subjects:
Grades:
5th - 8th
Central Tendency Notes - Mean, Median, Mode, Range, and Outlier
These notes on central tendency (mean, median, mode, range, and outlier) are a great way to introduce the analysis of number sets! I have included examples for you to teach, or you can simply print out these notes for your students to have.
Subjects:
Grades:
6th - 9th
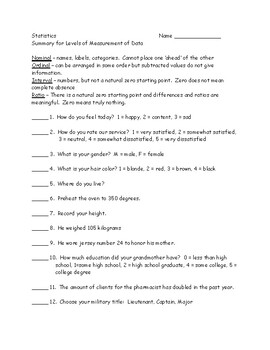
Statistics - Levels of Measurement of data
This worksheet is not a puzzle. My students have trouble with nominal, ordinal, interval and ratio. I made up this worksheet as extra practice. There are 25 problems with the answers on the back at the bottom. I've attached an extra back page if you do not want the students to have the answers. We had a huge discussion on number 12. "Choose your military title: Lieutenant, Captain, Major." The answer is nominal, even though there seems to be an order. BUT, not everyone knows the order o
Subjects:
Grades:
11th - 12th, Higher Education
Types:
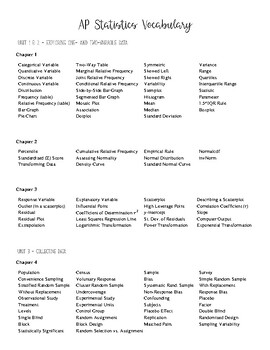
AP Statistics Course Vocabulary List
Aligned with the chapters of The Practice of Statistics (6th Edition), this is a list of the vocabulary used throughout the course broken down by unit and chapter.
Subjects:
Grades:
10th - 12th
Types:
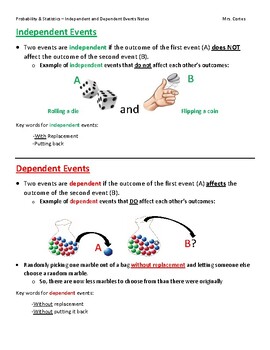
Independent and Dependent Events of Probability
Provide this as a quick resource to your students to enhance their understanding of Independent and Dependent Events as it relates to Probability!
Subjects:
Grades:
7th - 12th
Types:
CCSS:
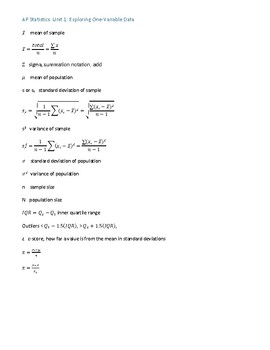
AP Statistics Unit 1 Notations and Equations
AP Statistics Unit 1 notations and equations for one-variable data
Subjects:
Grades:
10th - 12th
Types:

Display Describe & Summarize Data 20 Question Quiz with Key
Display Describe & Summarize Data 20 Question Quiz with KeyStatistical Questions, Mean, Median, Mode, Range, Dot Plots, Frequency Tables, Box Plots & Histograms
Subjects:
Grades:
5th - 8th
Types:
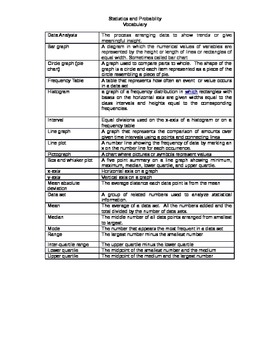
Statistics and Probability Vocabulary Words
This is a Word file that contains the vocabulary and definitions for CC 6.sp (Statistics and Probability).
Subjects:
Grades:
6th
Types:
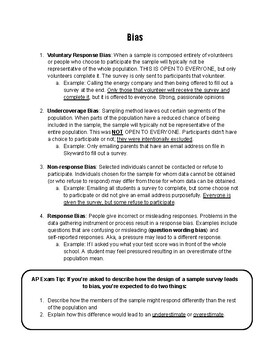
Types of Bias
These are notes for AP Statistics Unit 3: Bias. There are definitions listed as well as examples and helpful hints.
Subjects:
Grades:
9th - 12th

Find the Coefficients of a Binomial Expansion | TI-84 FREEBIE
Here is a great way to teach your students how to use the Graphing Calculator to find the coefficients of the Binomial Expansion, (a + b)^n, all at once. Sometimes these are called pascal's Numbers. These step by step instructions and examples are a clear and concise way to show the power of the TI 84 Graphing Calculator. Print full size 8 1/2 by 11" or at reduced size for Interactive Notebooks. ______________________________________ You may also like:★ Mega Bundle of 29 Graphing Calculator Han
Subjects:
Grades:
9th - 12th
CCSS:
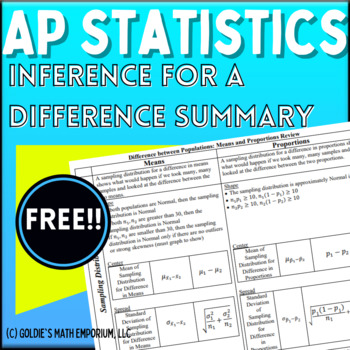
FREE AP Statistics Difference in Populations Summary
Differences in Populations Summary in AP StatisticsThis FREE resource will let you review the following in an easy organizer:two sample z intervals for proportionstwo sample z tests for proportionstwo sample z and t intervals for meanstwo sample z and t tests for meansIn this resource, you will get the editable WORD version of the summary, the PDF version, as well as an annotated answer key. You can use this resource after teaching confidence intervals or use it as AP Exam review.***************
Subjects:
Grades:
10th - 12th

Mean, Median, Mode, & Range Note Page
A reference page for students to understand mean, median, mode, and range!
Subjects:
Grades:
4th - 8th
CCSS:
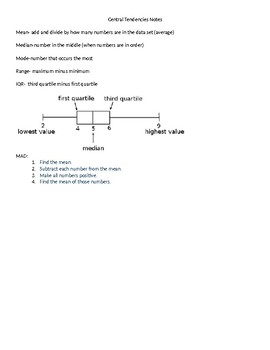
Central Tendencies Notes-mean, median, mode, box and whisker, MAD
notes aligned to NC common core 7th grade math (statistics)
Subjects:
Grades:
6th - 8th
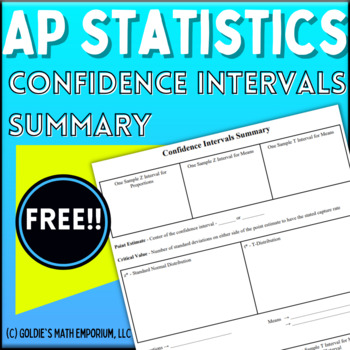
FREE AP Statistics Confidence Intervals Summary
Confidence Intervals Summary in AP StatisticsThis FREE resource will let you review the following in an easy organizer:one sample z intervals for proportionsone sample z and t intervals for meansIn this resource, you will get the editable WORD version of the summary, the PDF version, as well as an annotated answer key. You can use this resource after teaching confidence intervals or use it as AP Exam review.***************************************************************************************Th
Subjects:
Grades:
10th - 12th
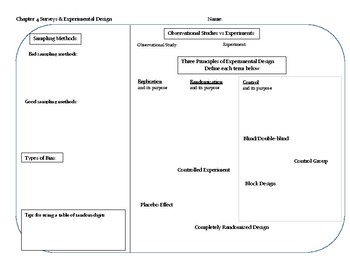
Surveys and Experimental Design Graphic Organizer
This graphic organizer places all survey and experimental design concepts for AP Statistics on one convenient page. Excellent for brainstorming or review, for a unit test or for the AP Exam at year-end. Concepts included: sampling methods, bias, observational studies versus experiments, three principles of experimental design, blinding, placebo, etc. A possible answer key is provided, but additional information could be easily discussed or added. A full set of graphic organizers for the year is
Subjects:
Grades:
10th - 12th
CCSS:
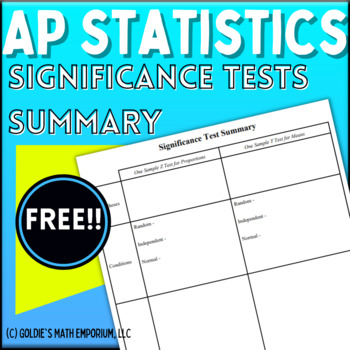
FREE AP Statistics Significance Tests Summary
Significance Tests Summary in AP StatisticsThis FREE resource will let you review the following in an easy organizer:one sample z tests for proportionsone sample z and t tests for meansIn this resource, you will get the editable WORD version of the summary, the PDF version, as well as an annotated answer key. You can use this resource after teaching confidence intervals or use it as AP Exam review.***************************************************************************************This FREE re
Subjects:
Grades:
10th - 12th
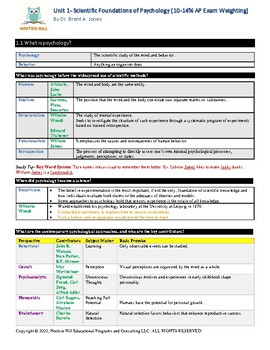
(23-24) AP Psychology Unit 1 Curriculum/Study Guide: Scientific Foundations
Dr. Brent A. Jones presents a comprehensive study guide for Unit 1: Scientific Foundations of Advanced Placement (AP) Psychology. He structured the study guide based on the College Board's Curriculum Guides available to teachers and over a decade of experience teaching the course. What is included?The study guide includes the items you need to know for AP Psychology Unit 1: defined terms, concepts, key figures, major research studies, theories, charts, and diagrams organized by unit and topic. T
Grades:
10th - 12th
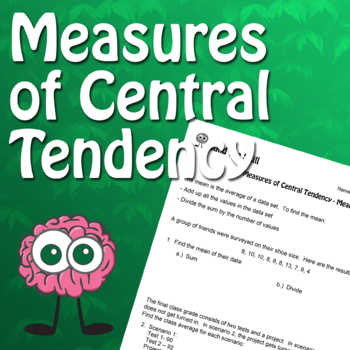
Build the Skill - Measures of Central Tendency
These activities correspond with the Measures of Central Tendency video playlist on our YouTube Channel (https://bit.ly/2LABfvU).Measures of central tendency attempt to describe a set of data by identifying a single value within a given set of numbers.Videos can be accessed via the QR code on each page. All answers are in the corresponding video, so you could use this as a self-guided activity.
Subjects:
Grades:
4th - 8th
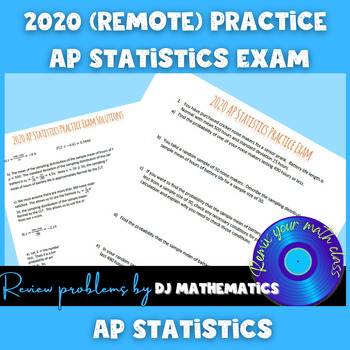
2020 AP Statistics Practice Exam
Emulate the COVID-Modified 2020 Exam with Confidence!Are you searching for a comprehensive practice resource that replicates the unique format of the COVID-modified AP Statistics Exam? Look no further! Our meticulously crafted practice exam is specifically designed to equip you with the skills and knowledge necessary to ace the real exam.This two-question multi-part exam is thoughtfully curated to cover a broad spectrum of course material. With its carefully selected questions, this resource cha
Subjects:
Grades:
9th - 12th
Types:
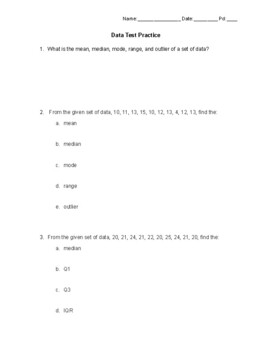
Data/Statistics Test Practice
This is a practice test created for the data analysis/statistics unit. This includes solving for the mean, median, mode, and range of a set of data, as well as 5 number summary and box and whisker plots. This could be used as a test, study guide, homework assignment, or extra credit! There are 6 questions and the answer key is included.
Subjects:
Grades:
6th - 8th
Types:
Showing 1-24 of 54 results


