47 results
Free statistics internet activities
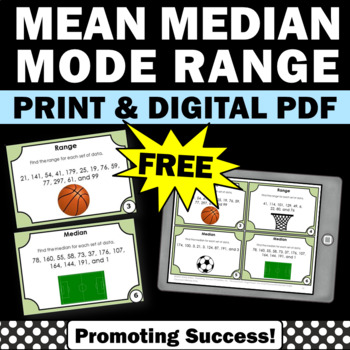
FREE Statistics and Probability Mean Median Mode Range Task Cards 5th 6th Grade
DIGITAL PDF AND PRINTABLES: You will download six free mean, median, mode and range task cards for your 5th or 6th grade students to practice finding the mean, median, mode and range. You may use the printable task cards in math centers or stations for fun review games and activities, such as a scavenger hunt or SCOOT. They also work well for transition activities, as exit tickets and for morning work, quick formative assessments. Game ideas, a student response form and answer key are included.✔
Subjects:
Grades:
5th - 6th
Types:
CCSS:
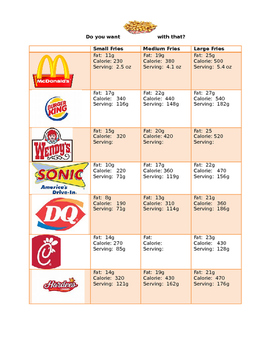
French Fry Scatter Plot & Best Line of Fit
Students will compare the nutritional values and serving sizes of french fries from various fast food restaurants. Based on this information, they will create scatter plots, best lines of fit and the equation of the trend line. Using the equation, they will estimate the unknown values of kid meals and supersized portions of french fries.
Subjects:
Grades:
8th - 11th
Types:
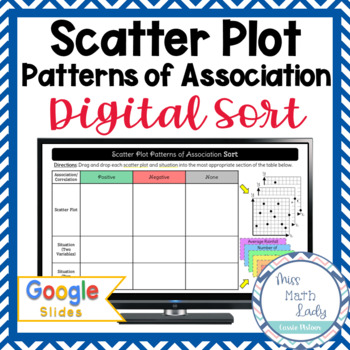
FREE Scatter Plots and Patterns of Association GOOGLE Slides
Students will complete this FREE Google Slides activity to sort scatter plots and bivariate situations based on their patterns of association or correlation. Students will identify the type of association or correlation by dragging and dropping scatterplots and short descriptions of situations that include two variables into a table. This interactive online activity is a great way to incorporate technology in the classroom as well as outside of the classroom through distance learning or remote l
Subjects:
Grades:
8th
Types:
CCSS:
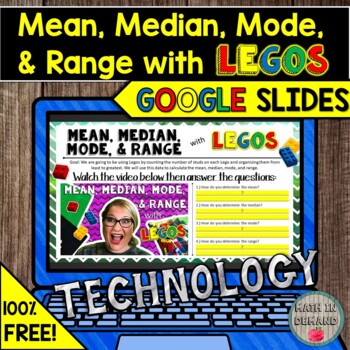
FREE Mean, Median, Mode, and Range with Legos in Google Slides Distance Learning
This is a FREE GOOGLE SLIDES resource on mean, median, mode, and range using Legos. Students will watch a video that shows 2 examples on how to determine the mean, median, mode, and range using Legos. They will use this video to help them solve 4 problems in Google Slides.You will be given a link that you can place in your Google Classroom. This resource is great because it involves NO PREP and has a video embedded in the resource.
Subjects:
Grades:
6th - 8th
Also included in: DIGITAL MIDDLE SCHOOL MATH GOOGLE SLIDES DISTANCE LEARNING RESOURCES
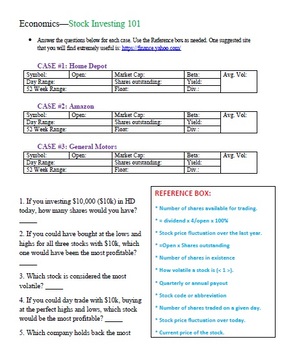
Stock Investing 101
For high school (and savvy middle school) economics students, Stock Investing 101 is a great tool for students to explore stocks on the Stock Market. This worksheet can be easily edited by simply changing the companies that the students need to investigate in order for it to be used over and over again. Estimated time for student completion: 45-60 minutes
Subjects:
Grades:
7th - 12th
Types:
Manage Sports Statistics in Google Drive / Google Sheets - Activity
Use Google Sheets to analyze sports data
This activity lets students practice several fundamental spreadsheet skills, including:
-renaming documents
-adding formulas
-inserting / formatting charts
Screenshots demonstrate how to do all of the above in Google Sheets, the spreadsheet application in the Google Drive suite. You can add additional statistics to customize the assignment for your students and adjust the level of difficulty.
Aligned to the following Massachusetts Technology Literacy
Grades:
5th - 8th
Types:
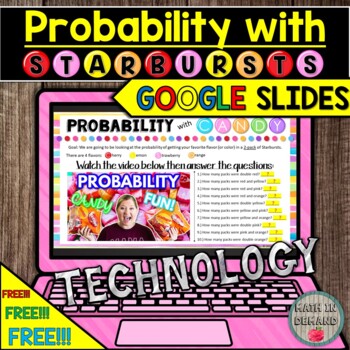
Probability with Starbursts Activity in Google Slides Distance Learning
This is a FREE GOOGLE SLIDES resource on the probability of obtaining your favorite flavor in a 2-pack of Starbursts. Students will watch a video that shows me unwrapping 74 Starbursts. They will calculate the probability of getting two red Starbursts, two orange Starbursts, and etc.You will be given a link that you can place in your Google Classroom. This resource is great because it involves NO PREP and has a video embedded in the resource.
Subjects:
Grades:
6th - 9th
Types:
Also included in: DIGITAL MIDDLE SCHOOL MATH GOOGLE SLIDES DISTANCE LEARNING RESOURCES
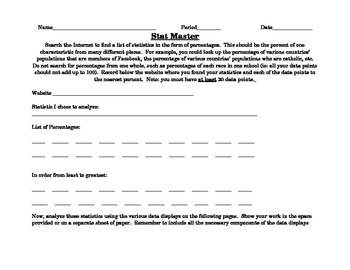
Stat Master- Statistics Analysis and Data Displays
This web-based performance task allows students to find statistics on the internet and the analyze and display the statistics using various displays. Finally, students are prompted to write about their analysis, explaining when specific displays are used and justifying their choice of a given display.
The data analysis and displays included are:
-Measures of Central Tendency (mean, median, mode)
-Measures of Variation (extremes, quartiles, or five-point summary)
-Box-and-Whisker Plot (or Box p
Subjects:
Grades:
5th - 9th
Types:
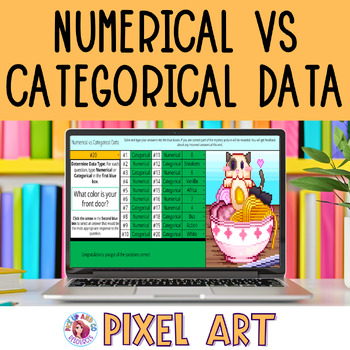
Numerical or Categorical Data 6th Grade Math Pixel Art Activity
This No-Prep 6th Grade Math Numerical and Categorical Data Google Sheets™ pixel art activity is what you need for digital practice with your math class. Review identifying the difference between numerical or categorical data with this digital self-checking pixel art. It is fun, engaging and interactive. This statistics activity could be used as a review, bell ringer, or in place of a traditional worksheet. Best of all, it’s a massive time saver for you because it is No-Prep and it requires no m
Subjects:
Grades:
6th
Also included in: 6th Grade Math Statistics Pixel Art Activity Bundle for 6.SP
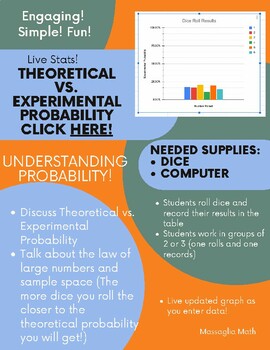
Experimental vs Theoretical Probability
Have your students roll dice and look at the data. Discuss the theoretical probability of rolling a 1 vs experimental probability. What happens as the same size increase?Students work in groups of 2 or 3 and record their data. You can have everyone tell you their data and type it in, or you can have the students type their data into the shared google sheet. As they type the stats will update live and they have a graph showing them each roll. *Note: If you don't have dice you can use an online di
Subjects:
Grades:
8th - 12th
Types:
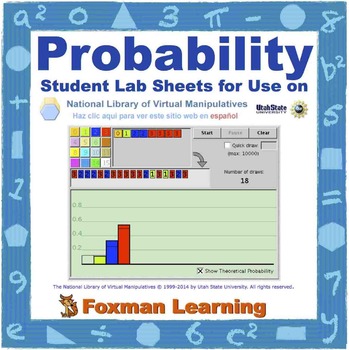
Probability -- Virtual Manipulatives Lab for Middle School Math CCSS Common Core
This lab guides students through five of the probability virtual manipulatives (applets) from the nlvm website: Coin Tossing, Box Model, Spinners, Stick or Switch, and Hamlet Happens. These virtual manipulatives are a great way for students to explore theoretical and experimental probability by very quickly simulating flipping a coin 100 times, spinning a spinner 500 times, or randomly drawing letters from the phrase “To Be or Not to Be” until their chosen word is selected by chance. My students
Subjects:
Grades:
6th - 8th
Types:
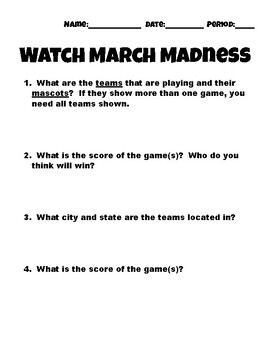
March Madness Math!
Super fun way to incorporate Basketball and March Madness into your Math Classroom. Contained within is 4+ days of activities designed for 40 minute class periods. Students will learn about current sports topics and calculate percentages. They will also practice basic basic statistics like mean, median, mode and range as well as identifying real world stats during live or recorded games.
Subjects:
Grades:
7th - 12th
Types:
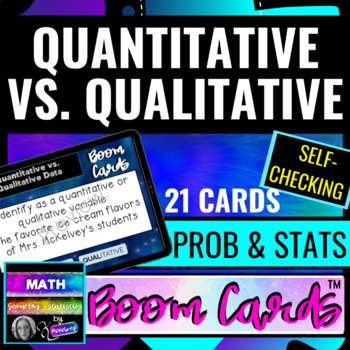
Prob & Stats Quantitative vs Qualitative using DIGITAL SELF CHECKING BOOM CARDS™
Probability and Statistics students will enjoy practicing classifying and identifying Qualitative vs. Quantitative Data with these fun and interactive FREE digital Boom task cards! Boom Cards are NO PREP required and SELF-CHECKING. I use Boom Cards with all of my classes and my students LOVE them. Boom Cards can be used as a synchronous whole group activity OR can be assigned to students to complete asynchronously from individual devices. These digital task cards provide students with instant fe
Subjects:
Grades:
11th - 12th, Higher Education
Types:
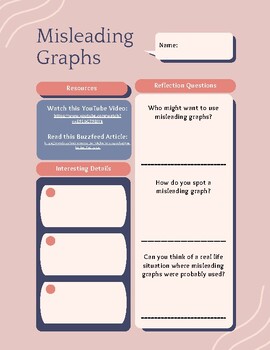
Misleading Graphs Reflection Activity
This is a cute worksheet inviting students to reflect on misleading graphs in statistics. This is an introductory activity inviting students to reflect on a TedEd video and a Buzzfeed article. Enjoy!
Subjects:
Grades:
10th - 12th, Higher Education
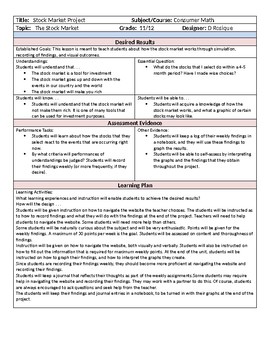
Stock Market Project plus Graphing and Data Recording
This is a project that I use in my classroom to teach students how the stock market works and what the data looks like after a period of at least three months. Students record data findings weekly, and after a period of at least twelve weeks, the graph their findings. This is useful in illustrating how the stock market goes up and down with the events that are happening throughout the world.
Subjects:
Grades:
11th - 12th
Types:
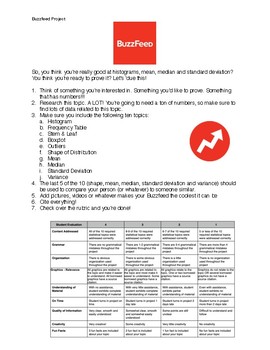
Buzzfeed Project - Statistics
This project is intended to be used after discussing topics such as: mean, median, mode, standard deviation, and histograms. Students really love this activity because they get to pick a topic that is interesting to them. The hardest part for students is finding the data sometimes.
Subjects:
Grades:
7th - 12th
Types:
MiniLab Hands-on and Virtual with Buffon's Needle Probability Experiment and Pi
This short lab guides students through a hands-on and a virtual experience with the famous Buffon’s Needle experiment. NOTE: This lab sheet is designed to use a 1.25 inch paperclip. This is a great way for students to explore theoretical and experimental probability by very quickly simulating dropping a coin 100’s and 1000’s of times. There are multiple resources online describing the history of this experiment and various versions of the online interactivity. Other labs for Middle School Math a
Subjects:
Grades:
7th
Types:
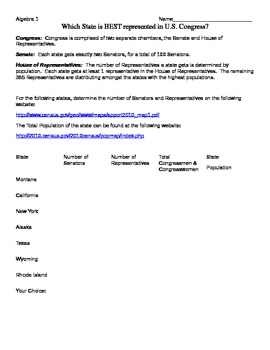
US Congress Ratios
This activity examines how each state is represented in the House of Representatives, Senate and Congress overall. Students examine what a low ratio of population to representatives means and what a high ratio of population to representatives means. Which states have the "best representation" and which states have the "worst representation".
Subjects:
Grades:
8th - 12th
Types:
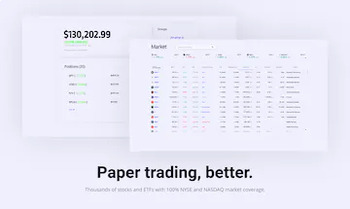
Personal Finance Game: Stock Market Simulator, Stradr.com
Stradr.comFree paper trading platform with education settings that hide user interaction, local groups for classroom competition, and global currency for all users, regardless of location. Also includes aftermarket trading, fractional shares, and the ability to start an account with as little as a cent of simulated money. Account resets also offered.
Subjects:
Grades:
Not Grade Specific
Measures of Center & Range Student Practice
These Google Slides can be used for both In Person and Remote Learners.Students are given multiple slides with data listed.They are to find the measure of center or range that is being asked.Median slides are interactive so students can place them in order.
Subjects:
Grades:
5th - 6th
Types:
CCSS:
11:07
LINE PLOTS (Dot Plots) Instructional VIDEO for Remote Distance Learning
This 11 minute video contains complete examples for LINE PLOTS.1st EXAMPLE: Depicts the steps needed to create (construct) a Line Plot. 2nd EXAMPLE (set of 3): Depicts reading and interpreting Line Plots.SUPPORTING DOCUMENT: A printable version for the examples in WORD.You can find FREE PRODUCTS for my store at: FREE PRODUCTS - iLoveToTeachKidsMore FREE PRODUCTS at: FREE PRODUCTS - KeepItSimpleStudents
Subjects:
Grades:
4th - 10th

The Statistics In Birthdays and Clouds: Graphing and Modes of Central Tendency
The Statistics in Birthdays and Clouds
Abstract:
Part one of this lesson uses birthdays to 'hook' a student to statistics. Using measures of central tendency, students will predict the weather of their next birthday.
Part two allows students to use even more complex data sets to make inferences and conjectures about cloud coverage and amount of rainfall.
This particular lesson uses Landsat 1-3 Data specific to the Charleston, SC area.
Subjects:
Grades:
6th - 7th
Distance Learning Graph of the Week Warm-up Template and Samples: Collection 3
This product includesVersion 1 Digital Template for Graph of the Week (Side-by-side comparison of graphs)Version 2 Digital Template for Graph of the Week (Analyze graphs separately then compare)10 Ready to Use Samples that utilize each of the templates.These interactive Google Slides templates allow you to share a Graph of the Week with your students and allow them to type a response/analysis for each of the Graphs.These samples work great in conjunction with my Digital Math Warm-up Templates.Ot
Subjects:
Grades:
6th - 12th
ABS Census Spotlight Task - Australia Demography Geography
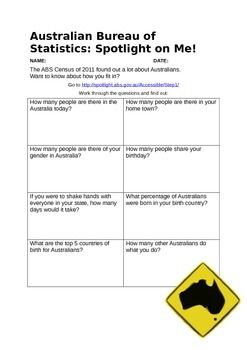
A quick question sheet I made to guide students through using the Australian Bureau of Statistics 'Spotlight' website which asks the kids questions (such as what's your age) and provides information about the results of the census. Check it out yourself: http://spotlight.abs.gov.au/Accessible/Step1/
I chose the 'accessible' variant because I found the normal flash version (http://spotlight.gov.au) to be dull.
I'm going to use this as part of our Year 8 Changing Nations Geography unit.
The ABS
Subjects:
Grades:
4th - 9th, Staff
Types:
Showing 1-24 of 47 results


