113 results
Higher education graphing resources $5-10
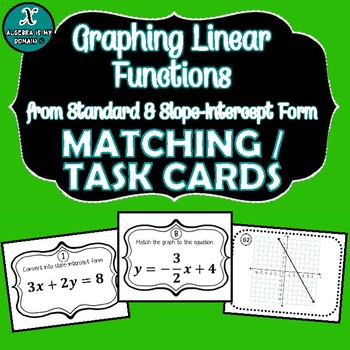
MATCHING / TASK CARDS - Standard & Slope-Intercept Form & Graphing of Lines
This file contains a set of 16 cards with linear equations in standard form, 16 cards in slope-intercept form, and 16 cards with graphs. Each card in standard form matches to one card in slope-intercept form and another card with a graph.The teacher can give use each individual set as task cards or use all three sets as matching cards.Included is an answer sheet for the students to write their answers. Teacher solution included!Great partner activity!
Subjects:
Grades:
7th - 12th, Higher Education, Adult Education, Staff
Types:
Crash Course Statistics Episodes #6-10 (Distributions, Sampling Methods, Graphs)
Distance Learning - #distancelearning Online Resources - #onlineresourcesEpisode Guides for Crash Course Statistics YouTube Series!Each guide comes with two versions (with and without timestamps), and a complete answer key.This product easy to use, no-prep product is a perfect last minute lesson plan, review activity, extra "filler" to keep on hand, substitute lesson plan, or homework assignment.*Great AP test prep!Plus it's only $1 per episode!-Answer key included for every episode guide-Questi
Subjects:
Grades:
9th - 12th, Higher Education
Types:
Also included in: Crash Course Statistics Episodes #1-25 BUNDLE

Parent Functions and Transformations, Personality Match-Up Bundle
BUNDLED for 40% savings!Three unique small-group activities encourage students to analyze parent functions and their reflections, horizontal shifts, and vertical shifts.Each activity requires students to match "personality clues" to a variety of equations. All three activities include answer keys and whole-class follow-ups with large graphs.**Click the PREVIEW to see every page.**PARENT FUNCTION BUNDLE INCLUDES:Parent Functions Personality Match-Up, Activity 1Transformations of Parent Functions
Subjects:
Grades:
9th - 11th, Higher Education
Types:
CCSS:
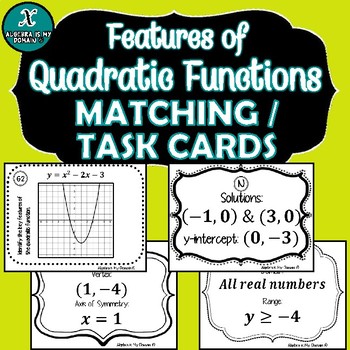
TASK CARDS / MATCHING ACTIVITY - Algebra - Parabolas & Quadratic Functions
Set of 64 total task cards / matching cards. These cards have been designed to be used to review a unit on quadratic functions.There are sixteen (16) task cards with a quadratic function and its graph. Students will then identify the vertex, axis of symmetry, the solutions (roots), y-int, domain, and range.This file includes:(16) cards with an quadratic function and graph(16) cards with the vertex and axis of symmetry(16) cards with the solutions (roots) and the y-intercept(16) cards with the
Grades:
7th - 11th, Higher Education, Adult Education
Types:
CCSS:
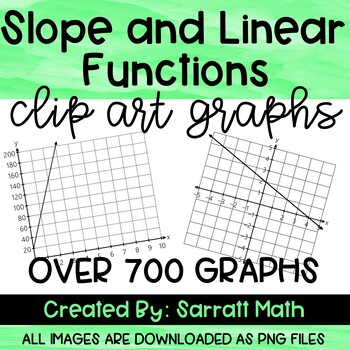
Slope and Linear Functions Clip Art Graphs - Math Clip Art
Looking for algebra 1 clip art images to make resources for your classroom? This linear function clip art graph set contains over 700 png files that include:Graphs with positive and negative slopesGraphs with zero and undefined slopes (horizontal and vertical lines)2 Blank graphs (5x5 and 10x10)Various graph sizes: 5x5 grid and 10x10 grid (x and y both increase by 1 unit)x increase by 1 and y increase by 2x increase by 1 and y increase by 3x increases by 2 and y increases by 2x increases by 1 an
Subjects:
Grades:
7th - 12th, Higher Education
Interpreting Graphs and Charts
Students work with a variety of 25 graphs and charts and learn how to interpret the information provided. The format varies from one to the other: pie, column bar, horizontal bar, line/dot, and picture (volcano) graphs and table charts. Appropriate for math, Social Studies, ELA, ESL, and Spanish culture. Can be used in Gr. 6-12, adult education, college, and home school. All answer keys provided.
Grades:
6th - 11th, Higher Education, Adult Education
Types:
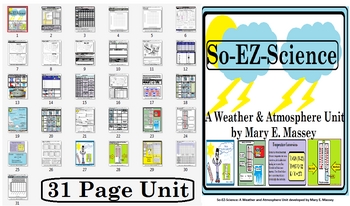
So-EZ-Science: Weather & Atmosphere Unit
This unit is a balanced literacy unit covering areas such as: temperature conversion, making a rain guage, recording weather, using weather station symbols, using the Beaufort Wind Scale, fronts, cloud types, cloud cover, graphing precipitation, graphing temperature, graphing weather phenomenon, weather tools, relative humidity, calculating relative humidity, precipitation, interpreting weather symbols on a weather map, reading a weather map, wind velocity, wind direction, wind speed, reading a
Subjects:
Grades:
3rd - 12th, Higher Education, Adult Education, Staff
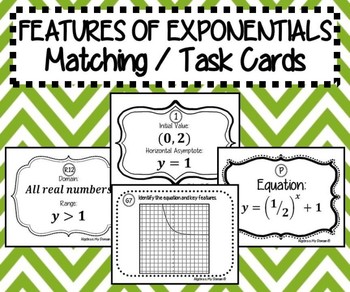
TASK CARDS / MATCHING ACTIVITY - Algebra - Features of Exponential Functions
Set of 80 total task cards / matching cards. These cards have been designed to be used to review a unit on exponential functions.
There are twenty (20) task cards with an exponential equation. Students will then match it to its graph, identify the initial value (y-int), horizontal asymptote, domain, and range.
This file includes:
(20) cards with an exponential equation
(20) cards with the graph
(20) cards with the initial value and horizontal asymptote
(20) cards with the domain and range
T
Grades:
9th - 12th, Higher Education, Adult Education
Types:
CCSS:

Desmos Graphing Project (Review)
This project is meant as a review of linear functions as well as transformations in the coordinate plane (translations, reflections, rotations, dilations). Students get to choose which transformation to perform, so it does not "review all transformations". Students use Desmos to outline a letter, usually an initial, (restricting domain and range) and then transform it within Desmos (in a table). For easier projects: pick transformations for students to perform (translations, dilations) and walk
Grades:
8th - 12th, Higher Education, Adult Education
Weather LAB: Greenhouse Effect (A Must have for Combining Science and Math!)
PROCEEDS BENEFIT "REACH INC."-EMPOWERING ADULTS WITH DISABILITIES
http://www.reachinc.org
-Southern Science Specialists - Chapel Hill, North Carolina-
A MUST HAVE!
The Greenhouse Effect – one of the MOST MISUNDERSTOOD concepts in Earth Science. This LAB is a MUST HAVE! See PREVIEW!
A great blend of math (calculations and graphing), meteorology, physical science, and the scientific method.
No Materials? NO Problem! Students can complete this lab with the recommended materials or without u
Subjects:
Grades:
5th - 10th, Higher Education
Types:
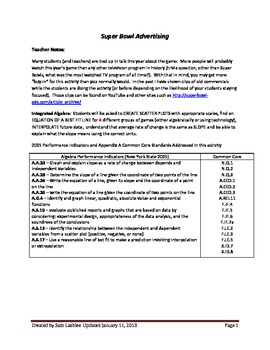
Television advertisements Slopes, regressions, lines of best fit Superbowl
Students will be asked to create two scatter plots (one for games 1-23 and a second for games 24-46). Students will then choose appropriate regression models for the growth of advertising costs. Students will choose these models based on visual representations as well as appropriate r or r2 values. Teachers can also introduce residuals here. Teachers can also help the students graph the equations as a piecewise function so that they can see the change in growth rate. Super Teachers need to
Subjects:
Grades:
7th - 12th, Higher Education, Adult Education, Staff
Types:
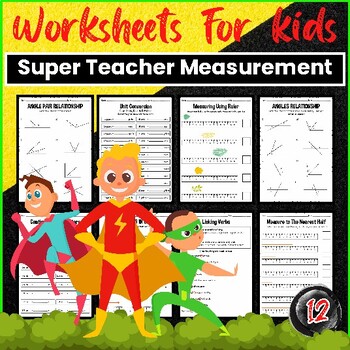
Super Teacher Worksheets Measurement
Super Teacher Worksheets is an essential resource for educators and parents seeking high-quality measurement activities and exercises. With a wide range of engaging worksheets, this platform caters to the needs of both teachers and students. From understanding the basics of measurement to mastering complex concepts, Super Teacher Worksheets provides invaluable practice and reinforcement. Whether you are a teacher searching for supplementary materials or a parent looking to support your child's l
Subjects:
Grades:
7th - 12th, Higher Education, Staff
Types:
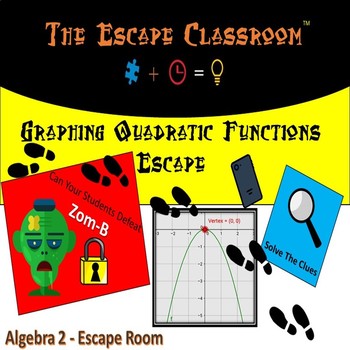
Graphing Quadratic Functions Escape Room - Algebra 1 & 2
**SEE THE PREVIEW AND FIND OUT FOR YOURSELF WHY WE ARE THE ORIGINAL AND THE #1 ESCAPE ROOM MATERIAL USED BY THOUSANDS OF TEACHERS AND SCHOOLS**INCLUDES: 1) Escape Room Activity2) Handout Material3) Lesson Plan On Subject 4) Power Point Presentation5) Promotional Videos 6) How-To Video7) Count Downs 8) Test **The interactive nature of our videos set us apart from all other curriculum sources. Students LOVE our Super Villains, and will beg you for more. When was the last time your students begged
Subjects:
Grades:
9th - 12th, Higher Education
Types:
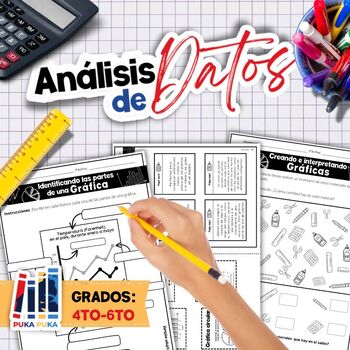
Trabajando con Datos (Gráficas y Análisis de Datos)
¡Domina el mundo de los datos con nuestras hojas de trabajo de Gráficas y Análisis de Datos!¿Estás listo para sumergirte en el fascinante mundo de los datos y aprender a transformarlos en información valiosa? ¡Nuestras hojas de trabajo de Gráficas y Análisis de Datos son la herramienta perfecta para ti!¿Qué encontrarás en nuestras hojas de trabajo?1- Identificando los tipos de gráficas (barra, lineal o puntos, pictográfica, circular).2- Identificando las partes de una gráfica (ejes, variables, t
Grades:
4th - 6th, Higher Education
Types:
Also included in: Bundle: Trabajando con Datos (Gráficas y Análisis de Datos)
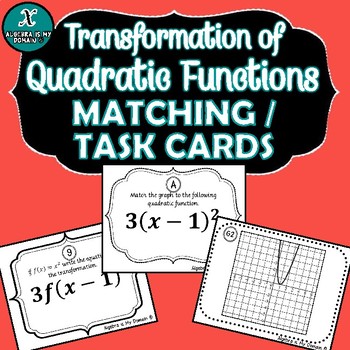
NOTES & MATCHING / TASK CARDS - Algebra - Transformations of Quadratic Functions
Set of 48 total task cards / matching cards. These cards have been designed to be used to review a unit on graphing transformations of quadratic functions and identifying the transformations.Students are given a transformation in function notation. They will determine how to rewrite the new equation, and match it to the graph. Then students will determine what transformations occurred.This file includes:* 16 cards with transformation in function notation* 16 cards with a new equation* 16 card
Grades:
7th - 12th, Higher Education, Adult Education
Types:
Crash Course Statistics Episodes #1-5 (Central Tendency, Charts, and Graphs)
Distance Learning - #distancelearning Online Resources - #onlineresourcesEpisode Guides for Crash Course Statistics YouTube Series!Each guide comes with two versions (with and without timestamps), and a complete answer key.This product easy to use, no-prep product is a perfect last minute lesson plan, review activity, extra "filler" to keep on hand, substitute lesson plan, or homework assignment.*Great AP test prep!Plus it's only $1 per episode!-Answer key included for every episode guide-Questi
Subjects:
Grades:
9th - 12th, Higher Education, Adult Education
Types:
Also included in: Crash Course Statistics Episodes #1-25 BUNDLE
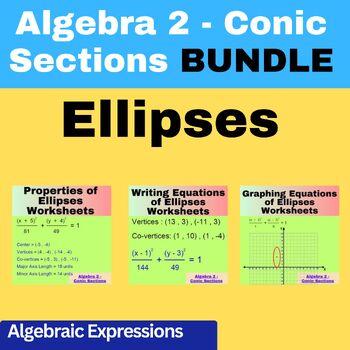
Algebra 2 -Conic Sections - Ellipses - Properties- Equations - Graphing -Bundle
Title: "Algebra 2 - Conic Sections: Ellipses Bundle"Description: Delve into the intricacies of ellipses within the realm of Conic Sections with our comprehensive bundle. This resource-packed bundle provides an extensive exploration of ellipses, covering their properties, equations, and graphing, tailored for Algebra 2 students.Bundle Components: Properties Handbook: Detailed explanations and summaries elucidating the properties of ellipses. Equations Guide: Step-by-step tutorials on formulating
Subjects:
Grades:
11th - 12th, Higher Education
Types:
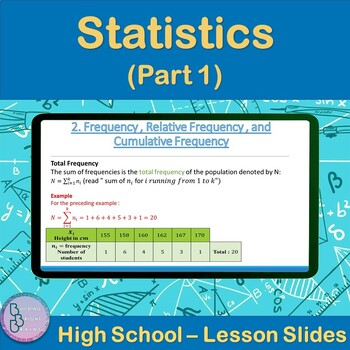
Statistics Part 1 | High School Math PowerPoint Lesson Slides
Are you teaching your High School students about Statistics? Plenty of examples and application exercises are included. You can also easily convert this to a Google Slides lesson by dragging it into your Google Drive.What is included?✦ 30 total slides for notes, examples and applications.✦ All steps are animated to allow the teacher to explain them gradually. Throughout the Lesson, students will be introduced to the following:✦ Statistics Vocabulary✦ Frequency , Relative Frequency , and Cumulati
Subjects:
Grades:
10th - 12th, Higher Education
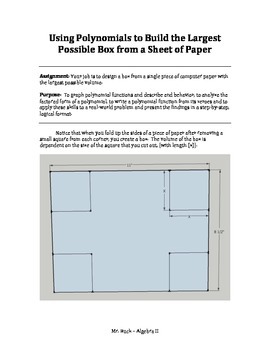
Algebra 2 Polynomials Activity and Lab - Using Polynomials STEM Poster Project
This 2-3 day math project gets students thinking about polynomials in the real world. Students design a box from a sheet of paper with the purpose of maximizing the volume and then display the entire mathematical process on a poster. Students add graphs, a model of the box and explain the entire mathematical process in a logical and sequential order. This project gets students working in groups, discussing ideas and writing about the process they take to solve a problem. Many find the poster
Subjects:
Grades:
10th - 12th, Higher Education
Types:
CCSS:
Histograms and Frequency Tables (Powerpoint) for Busy Teachers
This powerpoint presentation introduces the concept of histograms and frequency tables.
Clipart, sounds, and animation are used sparingly and effectively to help illustrate points without being distracting. This powerpoint presentation has been extensively refined using faculty AND student input and feedback.
Definitions of histogram, interval, frequency table, and frequency are all presented. The progression from a frequency table to a completed histogram is illustrated and animated using
Subjects:
Grades:
4th - 12th, Higher Education, Adult Education
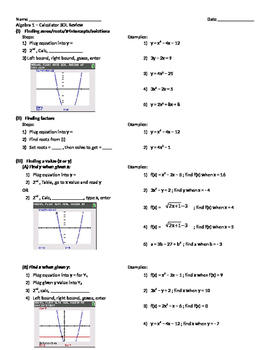
Algebra 1 Calculator Review (TI-84)
Comprehensive review of all graphing calculator concepts taught through the Algebra 1 course. Review concepts include finding roots, factors, values (x or y), y-intercept, mean, standard deviation, line/curve of best fit, and finding solutions to systems of equations. The review include steps and screenshots of the calculator.
Subjects:
Grades:
7th - 12th, Higher Education, Adult Education
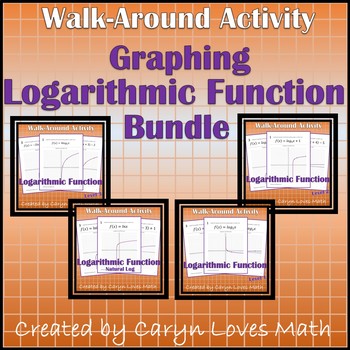
Graphing Bundle ~4 Logarithmic Functions Walk Around Activity
Graphing Logarithms Walk Around Activity BundleIncluded 4 Activities. Great for differentiation.Please check out the preview to see the equations included in this activity.Each activity also gets students up and about. Place the 12 cards on the wall around your room. Students pick any card to begin with. They should graph the function on the bottom of the page. After graphing on their own paper, students look around the room for a graph that matches theirs. Then they graph the next problem. The
Subjects:
Grades:
10th - 12th, Higher Education
Types:
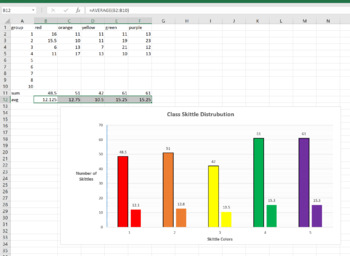
Skittle Statistics MS Excel Mini-Lab
This is a 1 class MS Excel lab for a computer or math class. You can have the students explore the distribution of different color Skittles in class. This is a great mini-lab or half-day activity when you school ends up with a weird schedule day. Tell them they can't eat till the Skittles till the end of class, or they will distort their numbers. Also make sure they don't throw them or shove them up their nose (Yes, stuck Skittles are hard to extract, ask me how I know..)The goal of this lab is
Grades:
6th - 12th, Higher Education, Adult Education
Types:
NGSS:
MS-ETS1-2
, HS-ETS1-2
, HS-ETS1-3
, MS-ETS1-4
, MS-ETS1-1
...
Also included in: Hands-on Science Semester Labs Bundle
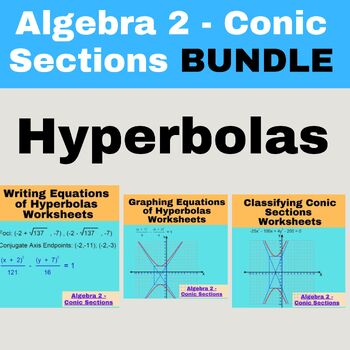
Algebra 2 - Conic Sections - Hyperbolas Worksheets BUNDLE
Dive into Hyperbolas with our Comprehensive Bundle! Unveil the mysteries of Conic Sections with our 'Algebra 2 - Conic Sections: Hyperbolas Worksheets Bundle.' Explore graphing equations, writing equations, and understanding properties of hyperbolas. Empower your students with the knowledge and skills to master hyperbolas effortlessly!"Welcome to the realm of Hyperbolas! This comprehensive bundle is meticulously crafted to aid students in mastering the complexities of Hyperbolas within Conic Sec
Subjects:
Grades:
11th - 12th, Higher Education
Types:
Showing 1-24 of 113 results


