Television advertisements Slopes, regressions, lines of best fit Superbowl
sam lashlee
23 Followers
Grade Levels
7th - 12th, Higher Education, Adult Education, Homeschool, Staff
Resource Type
Formats Included
- PDF
Pages
8 pages
sam lashlee
23 Followers
Description
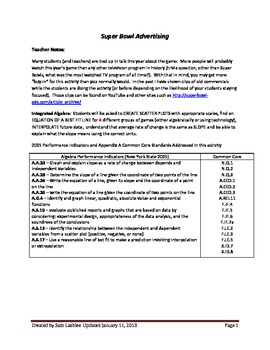
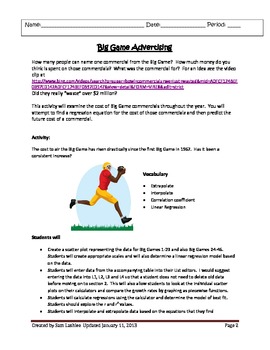
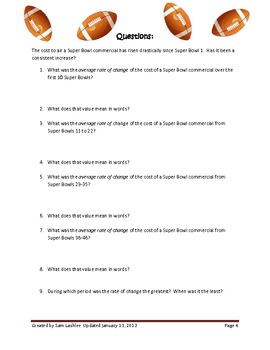
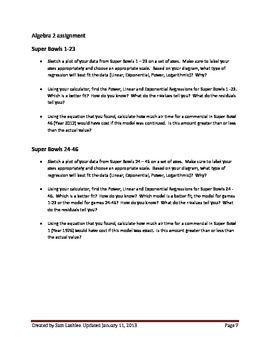
Students will be asked to create two scatter plots (one for games 1-23 and a second for games 24-46). Students will then choose appropriate regression models for the growth of advertising costs. Students will choose these models based on visual representations as well as appropriate r or r2 values. Teachers can also introduce residuals here. Teachers can also help the students graph the equations as a piecewise function so that they can see the change in growth rate. Super Teachers need to be aware that some students may use the Big Game number in their L1 while other students may use the year of the game. This will change the equation, but it will not change the predictions, correlation coefficients or residuals. Superbowl Linear, exponential, regression, correlation, data, table, graph, extrapolate, interpolate, interpret, superbowl, common core, 49ers, giants, patriots, saints, rams, falcons, ravens, jets, broncos, brady, ryan, manning, raiders, cowboys, texans, bengals, dolphins, bills, chargers, eagles, redskins, colts, bowl
Total Pages
8 pages
Answer Key
N/A
Teaching Duration
2 days
Report this resource to TPT
Reported resources will be reviewed by our team. Report this resource to let us know if this resource violates TPT’s content guidelines.


