127 results
Free higher education graphing resources
Slope Graphic Organizer and Guided Notes
This is a great graphic organizer to help students recall four different ways to find the slope of a linear function. These four ways include: From a graph, an equation, a table, and two given points.
The second graphic organizer helps students have a reference guide for positive, negative, zero, and undefined slope.
This graphic organizer has guided notes, multiple examples, and little tricks to help students remember positive, negative, zero, and undefined slope.
The Link-Slope Task Car
Grades:
6th - 12th, Higher Education, Adult Education
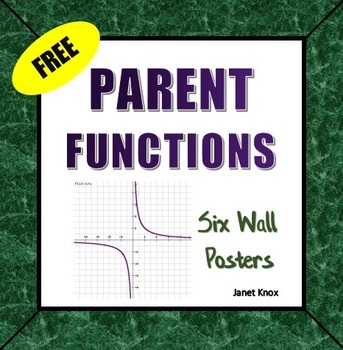
Parent Functions Posters
FREE DOWNLOAD: Six one-page graphs to display on a bulletin board or on your projector/Smart Board.
Posters include a linear, quadratic, cubic, rational, absolute value, and square root function.
------------------------------------------------------------------------------------------
Related products:
Introduction to Parent Functions...Notes + Flash Cards
Introduction to Parent Functions: Lesson, Posters, Flash Cards
Activity Bundle, Transformations of Parent Functions, 50% SAVINGS
Par
Subjects:
Grades:
8th - 11th, Higher Education
Types:
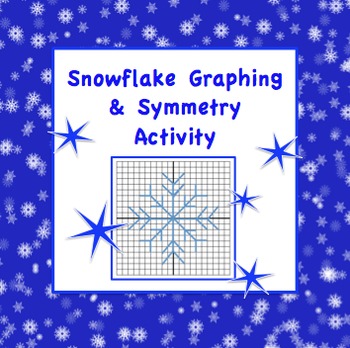
Snowflake Graph and Symmetry Activity for Coordinate Plane
Snowflake Graph and Symmetry Activity for Coordinate Plane
Not only do students need to know how to graph line segments in all four quadrants, they will use their symmetry skills to complete the snowflake.
Of course an answer key is provided!
ENJOY!!!
Connect with Me
Follow my WebsiteMath to the Core on FacebookMath to the Core BlogMath to the Core on PinterestMath to the Core on TwitterMath to the Core on Instagram
Grades:
7th - 12th, Higher Education, Adult Education
Types:
Graph Paper Sheet - Printable Grid Worksheet for Math (Algebra, Geometry)
Graph Paper Sheet - Printable Grid Worksheet for Math (Algebra, Geometry)You'll get a PDF file, measuring 8,5 x 11 inches.Includes a standard graph paper sheet. Printable grid paper worksheet for students.Perfect sheet for math class, including algebra and geometry.------------------------------------------------------------------------------------------------------Thank you for stopping by!You can contact me with questions about this product. Thank you for all reviews, ratings and comments you
Grades:
PreK - 12th, Higher Education, Adult Education, Staff
Types:
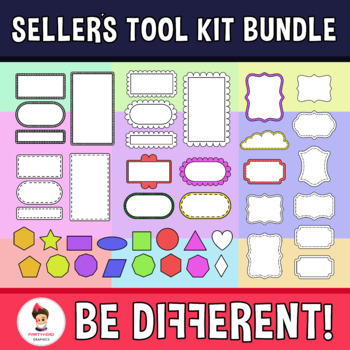
Seller's Tool kit Bundle - Frames, Shapes, Backgrounds, M. Exerc....
Enjoy! This set includes the following images on 300dpi.Here are the details:- Frames.- Backgrounds.- Differents shapes.- Covers.- Excercise pages.- Different colors for all.- Blackline version.Email: adolfo-1985@hotmail.comEnjoy and be happy :).TERMS OF USE: This resource is for limited educational and commercial use. Please make sure the images are flattened and/or protected. You can use it to create your own products as long as there is educational content included. This product can be used t
Grades:
PreK - 12th, Higher Education, Adult Education, Staff
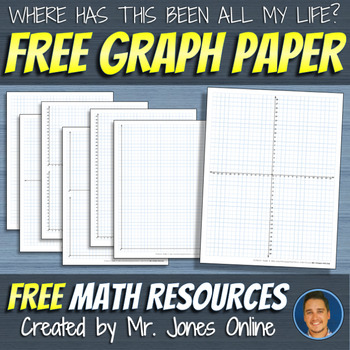
FREE! Graph Paper - Blank or Labelled, One and Four Quadrant!!
I always used to look online for graph paper and all I would find were small JPG images that could not be used for what I was trying to do!! NOT ANYMORE! These are HIGH QUALITY PDF DOCUMENTS that can be printed in color or grayscale for your graphing needs!!
Seven different styles of graph paper are included in this FREE bundle!!
Blank 8.5 x 11"
Four Quadrant Labelled (Full Page)
Four Quadrant Blank (Full Page)
One Quadrant Labelled (Full Page)
One Quadrant Blank (Full Page)
One Quadrant Labell
Subjects:
Grades:
3rd - 12th, Higher Education, Adult Education, Staff
Types:
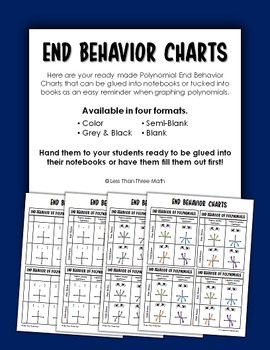
Polynomial End Behavior for Interactive Notebooks
An easy to use chart for determining end behavior of a polynomial. Use the sign of the leading coefficient (columns) and whether the degree is even or odd (rows) to predict what the graph will look like.
This PDF includes 4 different formats (color, grayscale, semi-blank, fully blank). Print at normal size for students to fill out or print 2 pages on one sheet of paper for extra small (but still readable) charts!
Perfect for interactive notebooks, using as bookmarks or general reference while
Subjects:
Grades:
8th - 12th, Higher Education
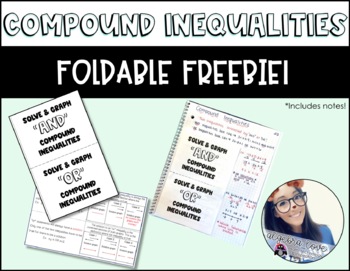
Compound Inequality Foldable *FREEBIE*
Compound inequality foldable for "and" and "or" inequalities. Also has graph solutions. Answer key included! ENJOY!
Subjects:
Grades:
6th - 12th, Higher Education, Adult Education
Centimeter & 1 Inch Grid Papers (Full Sheets Each)
A full sheet of Centimeter Grid Paper and a full sheet of 1 inch Grid Paper all contained in one easy to transport/store .pdf. You can use these sheets with making charts, plotting points, etc... Enjoy and thank you for your support.
Subjects:
Grades:
PreK - 12th, Higher Education, Adult Education, Staff
Types:
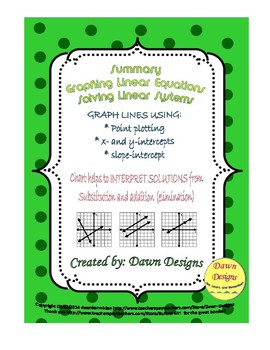
Summary of Methods for Graphing Linear Equations and Solving Linear Systems
This product consists of a Summary of Methods for Graphing a Linear Equation worksheet and a Summary of Methods for Solving Linear Systems.The Summary of Methods for Graphing a Linear Equation worksheet is a template with a summary of three methods for graphing a linear equation, including:~ Point Plotting~ X- and Y-intercepts~ Slope-InterceptInstructions are given for each method to guide the students through calculating points and plotting them on a graph. A blank is provided for an equation
Subjects:
Grades:
7th - 12th, Higher Education, Adult Education
Types:
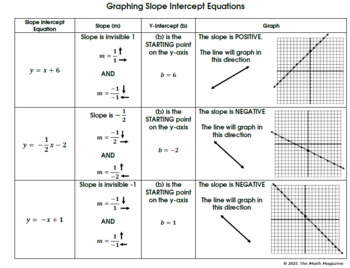
Graphing Linear Equations Slope Intercept Reference Sheet IEP Accommodation
This is a 2-page PDF document that I created to help my struggling students with graphing Slope Intercept Form Linear Equations. The reference sheet is organized as a chart that shows the following: - The equation - The slope of the equation, which is also marked with up and down arrows to show the correct graphing direction. - The y-intercept of the equation, which is also labeled as the "starting point". - The graph of the equation, which also points out whether the graph is positive or
Subjects:
Grades:
7th - 12th, Higher Education, Adult Education
Types:

Piecewise Linear Graphing and Symmetry Activity
Piecewise Linear Graphing and Symmetry Activity
Not only do students need to know how to graph linear equations with a given domain and range, they will use their symmetry skills to complete the snowflake.
A version without holiday clipart is also included.
Of course an answer key is provided!
Products you may also like...
Domain & Range of a Graph, Notes & Quizzes with inequality, interval and set builder notation.
Algebra Warm Ups
Algebra Flash Cards - What EVERY students NEEDS
Grades:
8th - 12th, Higher Education, Adult Education
Types:
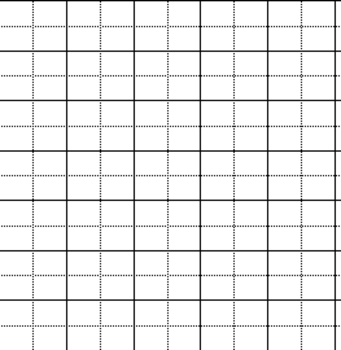
Graph Paper 16
This is a free sample of graph paper in Word format. Simply print out the page, or use it onscreen with an interactive whiteboard. This particular graph is 14x14, with subgrids equaling 28x28. It is one of 30 graph papers included in Graphs Grids & Games, a digital document by John Rice available on TeachersPayTeachers.com
Grades:
PreK - 12th, Higher Education, Adult Education
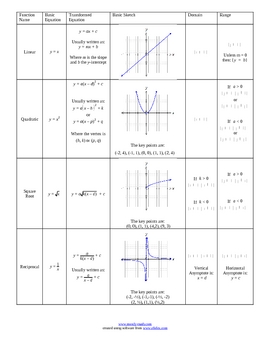
Transformations of Functions Summary
A basic summary of the transformation of functions, looking specifically at the quadratic, cubic, square root, reciprocal and exponential function. Lists domain, range and asymptotes where applicable.
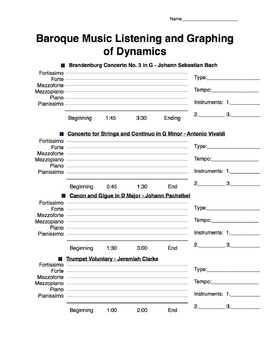
Baroque Music Listening and Graphing of Dynamics 1
Music/Math Integration Assignment
A definite administration pleaser, this graphic organizer was devised to have students listen, analyze, graph and compare dynamics, instrumentation, genre and more.
Directions: Have students listen to each piece and graph the dynamic level at each time interval. Use a metronome or have students calculate bpm with a clock.
Subjects:
Grades:
3rd - 12th, Higher Education
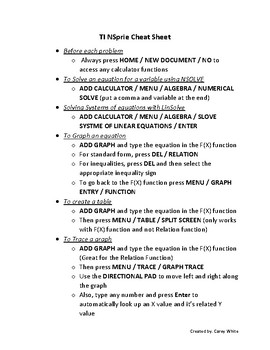
TI Nspire Calculator Cheat Sheet
This a cheat sheet is designed to help the users of the TI Nspire calculators. It gives detailed instructions on how to use certain functions on the calculator step by step. It was created to help my Algebra I students use the new calculator.
Subjects:
Grades:
7th - 12th, Higher Education, Adult Education, Staff
CCSS:
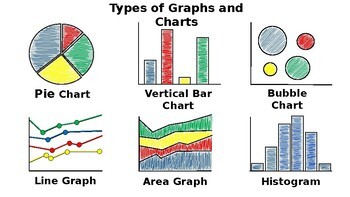
Types of Graphs and Charts - Science Journal Illustration
This is a step by step illustration of each of the 12 types graphs and charts that can be created using Microsoft Excel/Google Sheets. This can be used as an introduction to any Microsoft Excel/Google Sheets Graph and Charts lesson plan. Students use 2 pieces of blank paper and colored pencils to build background knowledge of the types of graphs and charts able to be utilized by entering data on an Excel/Google Spreadsheet and transforming the data into visual representations.
Graph Paper 1 CM Grid 8,5 X 11
Graph Paper: Grapg Paper 1 CM Grid 8,5 X 11Whit this download you will have all the Grap Paper for all of your projects.Delivered in a 10 page PDF for print.Use this for your Math projects.Leaving feedback not only earns you TPT credit but also helps me to shape my products to be the best that they can be! Thank you for your feedback - it truly means a lot to me.More math resources:Overcome Math Anxiety With These TechniquesEnjoy!
Grades:
9th - 12th, Higher Education, Adult Education, Staff
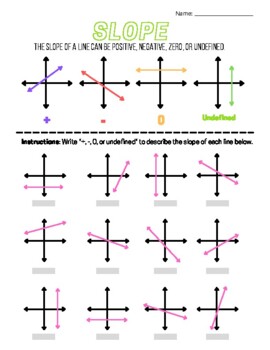
Intro to Slope (Types of Slope Worksheet w/Answer Key)
This worksheet introduce the four types of slope (positive, negative, zero, and undefined. The answer key is included!
Grades:
6th - 12th, Higher Education, Adult Education
Types:
Prism: Drawing, Introduction to Volume and Surface Area
Teach your students how to draw prisms before discussing volume and surface area. This template will allow your students to draw different examples of prisms using the isometric dot paper. Four different templates are available depending on the needs and capabilities of your students. Four step procedures to draw triangular prisms are provided for beginners. You can also tell your students to label the prism by its the vertices, edges and faces!
Grades:
1st - 12th, Higher Education, Adult Education, Staff

Solving Systems of Equations Foldable
Here is a free foldable for solving systems of equations. This foldable must be printed double sided. To fold this foldable first take the copy that says Elimination. You should have the word Elimination at the bottom of the paper facing you. Next take the paper that says Substitution. The Substitution should be at the bottom of the page facing you. Put the Substitution paper in front of the Elimination paper. Next slide the Substitution paper up so you can see the word Elimination below it. Fin
Grades:
7th - 12th, Higher Education
Blank Bar Graph : Bar Graph Template
Help children begin to collect and compare data with this Bar Graph Template.There are many reasons for us to use a blank graph/chart template - we can use them as an interesting way to teach students or ask your class to tally and compare data.Our blank bar graph template is perfect for use in your primary school classroom as it gives students a visual display to compare quantities and categories.Students can learn how to see relationships and patterns in objects, items and make data very easy
Subjects:
Grades:
1st - 12th, Higher Education, Adult Education, Staff
Types:
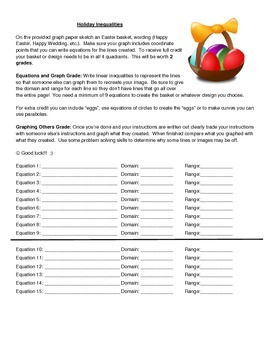
Linear Inequalities - Graph a Picture
In this activity students create their own image on a coordinate plane, write the inequalities for the lines created making sure to restrict the domain and range, and then switch their directions with a partner to graph each other's images. Great creative practice for students to review and continue with Systems of Inequalities.This work is licensed under a Creative Commons Attribution-NonCommercial-ShareAlike 3.0 Unported License.
Subjects:
Grades:
9th - 12th, Higher Education
Types:
CCSS:
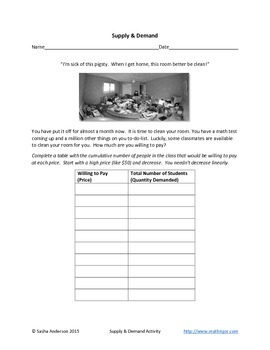
Supply and demand
A classroom activity where student build their own demand and supply curves based on what they are willing to pay (or be paid) for a clean room. Students must reason quantitatively and use units common in economics to solve problems in market equilibrium. Algebra- linear equations, systems of equations, and functions.
Subjects:
Grades:
9th - 12th, Higher Education, Adult Education
Types:
CCSS:
Showing 1-24 of 127 results


