132 results
Not grade specific graphing resources $5-10
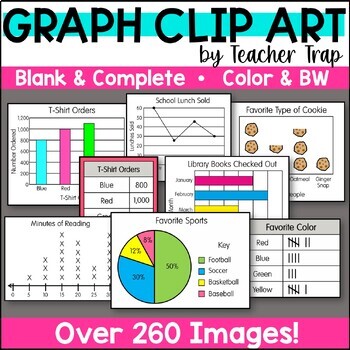
Graphs Clip Art | Bar Graphs | Pie Charts | Pictographs Math Clipart
This graphs clip art set has it all! Blank AND completed bar graphs, pie charts, pictographs, line plots, line graphs, tally charts, and more! Over 260 ready-to-go images AND blank template images included, along with a handy Quick Reference Guide!❤️ Commercial-use allowed. Use for creating math activities where students read, compare, or create different types of graphs and charts! Although not grade-specific, these graphs are targeted to 2nd-4th grade levels.▶️ LEARN MORE!!For all the details
Subjects:
Grades:
Not Grade Specific
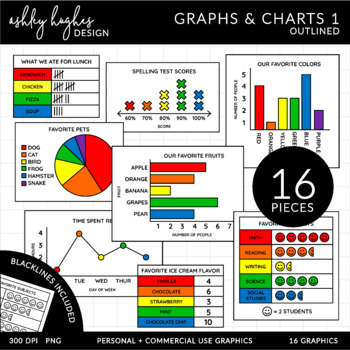
Graphs & Charts Clipart 1 - Outlined
This set of Graphs and Charts Clipart is perfect for your classroom creations!Check out Graphs and Charts Set 2 if you want clean simple images with no data.If you prefer a style that has unlined images, I have an Unlined Version.INCLUDED IMAGES (16):1 Bar Graph - Horizontal Orientation1 Bar Graph - Vertical Orientation1 Pie Chart1 Line Graph1 Line Plot1 Pictograph1 Number Chart1 Tally Chart8 BlacklinesThis clipart set is a collection of high quality .PNG files (300 DPI) for commercial or person
Subjects:
Grades:
Not Grade Specific
Also included in: LIFETIME Math Clipart BUNDLE - Outlined
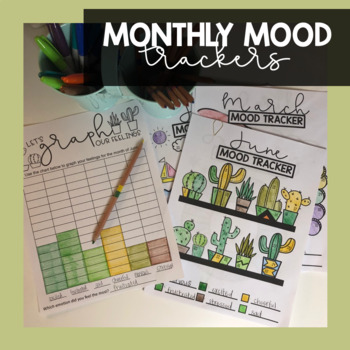
Monthly Mood Trackers
This is a growing product, purchase it now at a lower price!This product includes- 12 monthly mood trackers in two different formats (prefilled emotions and blank)- half page booklet form of both formats (organized in the standard calendar year form and the school calendar year form)- half page booklet form with graphing sheets for each month (standard and school calendar)- Graphing pages in both formats for each month that matches the monthly theme.- Reflection pages to match each monthly theme
Grades:
Not Grade Specific
Types:
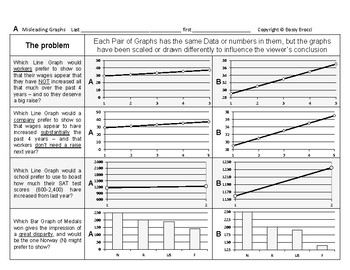
Stats&Data 14: Misleading & Misinterpreting Data Graphs Charts Statistics
This is an excerpt from my popular line ofBossy Brocci Math & Big Science workbooks on Amazon.ANSWER KEY included=======================Students will:1) Analyze 20 different Graphs or Data Displays2) Draw Conclusions & Answer questions about theaccuracy, fairness, limitations & legitimacy of those Graphs3) Answer 16 Multiple-choice questionsbased on their Calculations & Observations4) Be compelled to show their work in a neat & orderly format5) Be trained to methodically &
Subjects:
Grades:
Not Grade Specific
Types:
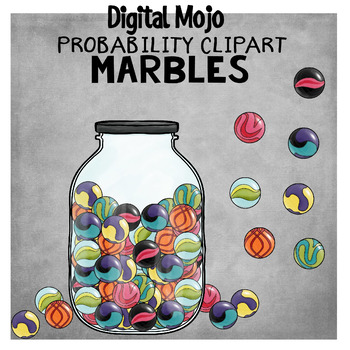
Marbles With Patterns – Probability Clipart
This patterned marble clip art set can be used to create probability math resources. It contains generic marbles, patterned marbles, a bag of marbles and a jar of marbles with a few variations. Generic marbleso 1 green and teal o 1 red and orangeo 1 pink, red and blacko 1 pink and redo 1 purple, teal and blacko 1 purple and yellowo 1 yellow and greeno 1 bag with generic marbleso 1 jar with generic marblesPatterned marbleso 1 green with heartso 1 pink with stripeso 1 purple with triangleso 1
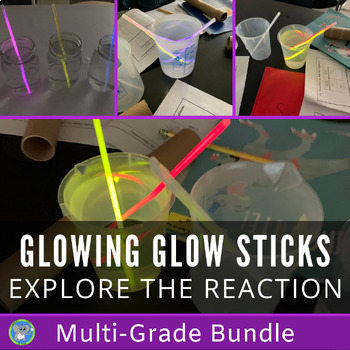
Chemical Reaction Bundle | The Science Of Glow Sticks | Light Activity
Engage students with the science of glow sticks. All grade levels teach the same concept but differentiate by age and abilities. This enables a teacher to teach the same concept at the same time. Great for the science lab teacher and homeschool family. By purchasing this bundle, you are SAVING 20% off each individual resource.Digital and Distance Learning Approved. This experiment uses simple supplies and can work well for a distance learning or digital activity. The teacher can perform the
Subjects:
Grades:
Not Grade Specific
NGSS:
5-PS1-3
, 5-PS1-4
, 2-PS1-4
, 4-PS3-3
, 2-PS1-1
...
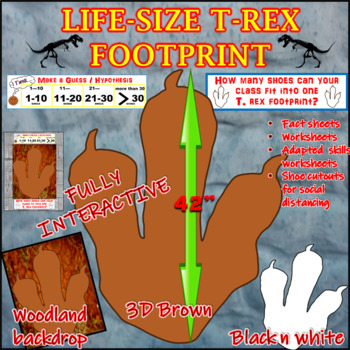
Life-Size T-Rex Dinosaur Footprint/Differentiated/Scientific Method / Adapted
To get weekly updates on new product releases, please FOLLOW us.Eager to stretch the minds of your students?Want them to be able to learn how to hypothesize a scientific wonder?This does just that! And More!This listing contains a LIFE-SIZE T-REX Footprint that measures 33 1/4” wide, and 42” long. You will absolutely LOVE this resource!Both my wife and I are Special Education/Life Skills Teachers, and we are constantly trying new ways to engage our students. One of the best ways we have found is
Subjects:
Grades:
Not Grade Specific
Types:
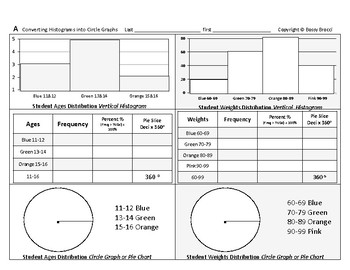
Stats&Data 03: Convert Histograms into Circle Graphs Construct Create Pie Charts
This is an excerpt from my popular line ofBossy Brocci Math & Big Science workbooks on Amazon.Answer KEY included=======================Students will:1) Convert 3 Vertical Histograms into3 Data Tablesand3 Colored or Shaded Circle Graphs (Pie Charts)2) Convert 1 Horizontal Histogram into1 Data Tableand1 Colored or Shaded Circle Graph (Pie Chart)3) Be compelled to show their work in a neat & orderly format4) Be trained to methodically & systematicallyPresent Data in different DisplaysN
Subjects:
Grades:
Not Grade Specific
Types:
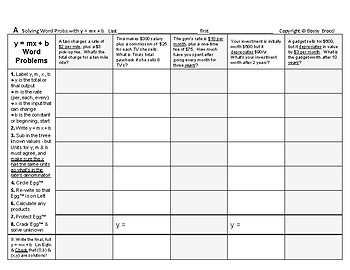
Graphing Linear Equations 11: Use Slope Intercept y = mx + b Solve Word Problems
This is an excerpt from my popular line ofBossy Brocci Math & Big Science workbooks on Amazon.====================Students will:1) Write 20 Slope-Intercept linear equationsfrom 20 Word Problems2) Solve for y 5 times, m 5 times,x 5 times & b 5 times3) Be compelled to show their work in a neat & orderly format4) Use the Bossy Brocci "Egg" method for solving algebraic equations5) Be compelled to show their work in a neat & orderly format6) Be trained to solve algebraic equations met
Grades:
Not Grade Specific
Types:
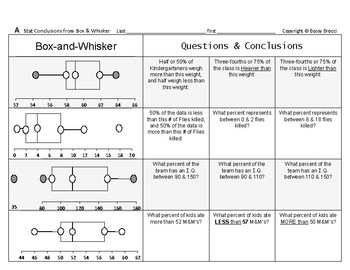
Stats&Data 09: Draw Statistical Conclusions from Box and Whisker Box Plots QUIZ
This is an excerpt from my popular line ofBossy Brocci Math & Big Science workbooks on Amazon.Answer KEY included=======================Students will:1) Analyze 8 Box & Whisker Plots (Box Plots)2) Answer at total of 24 questionsfrom those Plots regarding variousFraction & Percent Distribution portions3) Be compelled to show their work in a neat & orderly format4) Be trained to methodically & systematicallyTranslate or Convert Box & Whisker Plotsinto Fractions & Percen
Subjects:
Grades:
Not Grade Specific
Types:
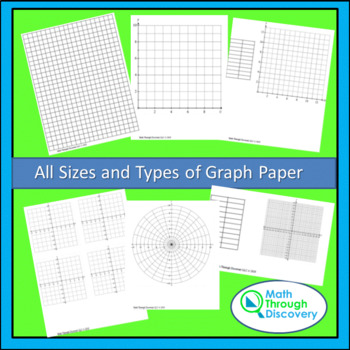
All Sizes and Types of Graph Paper
Do you need graph paper that is labeled, unlabeled, small in size, geoboard templates, polar graphs? This packet contains 60 different types of graph paper. Check the table of contents. 1. Four Standard Grid Pages2. Twenty Quadrant I Grid Pages3. Twenty-four Four Quadrant Grid Pages4. Four Geoboard Graph Pages5. Eight Polar Graph PagesA free set of sixteen sheets of trigonometric graph paper is available from my store. Sixteen Sheets of Trigonometric Graph PaperComments from buy
Grades:
Not Grade Specific
Types:
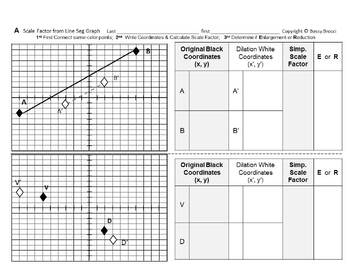
Transformations Slides 18: Dilations Calculate Scale Factors & Types from Graphs
From the Author of Bossy BrocciMath & Big Science workbooks on Amazon,comes student fillable editable interactiveGoogle Slides™ for Google Classroom™ Students can insert/overlay text & graphics[textboxes, shapes, lines, arrows, colors etc.]onto the G-Slide image backgroundorConvert to PDF, then make it interactive onlineby using various third-party Ed. websitesorPrint it for paper worksheetsAnswer KEY included=======================Students will:1) Plot/Graph, Color & Label 8 Origin
Grades:
Not Grade Specific
Types:
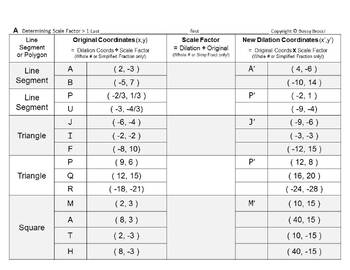
Transformations Slides 12: Dilations Calculate Scale Factors from Ordered Pairs
From the Author of Bossy BrocciMath & Big Science workbooks on Amazon,comes student fillable editable interactiveGoogle Slides™ for Google Classroom™ Students can insert/overlay text & graphics[textboxes, shapes, lines, arrows, colors etc.]onto the G-Slide image backgroundorConvert to PDF, then make it interactive onlineby using various third-party Ed. websitesorPrint it for paper worksheetsAnswer KEY included=======================Students will:1) Calculate and Write 10 Scale Factors,g
Subjects:
Grades:
Not Grade Specific
Types:
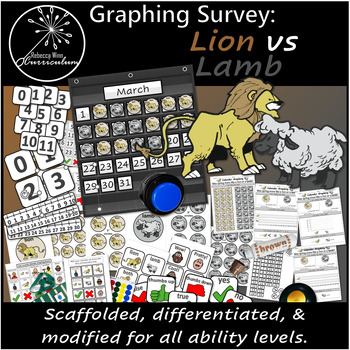
Lion vs Lamb Calendar Graphing | Comparison | Weather | Special Education
Calendar time will be memorable for students with this product. Give your students a fun way to practice communication and socialization while learning about the weather, counting, graphing, & number comparison. Your students will look forward to it every day and will love talking about the crazy spring weather! I hope you enjoy this product. Scaffolded graphing includes:· 3 levels of Lion vs Lamb calendar graphing results sheet levels· 1 level of Lion vs Lamb graphing tally sheet· Black and
Subjects:
Grades:
Not Grade Specific
Types:
NGSS:
3-ESS2-1
, K-ESS3-2
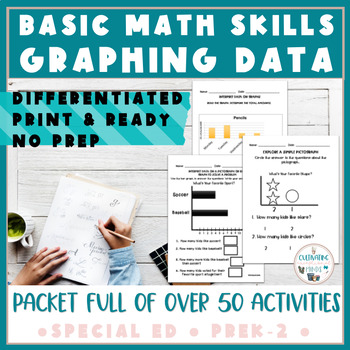
Math Skills | Home Learning Packet | Graphing & Data | ESY | End of Year
Need worksheets for your students to practice graphing? These graphing data worksheets can help your special education students master graphing skills on a daily basis. There are over 50 graphing data activities included in this download with varying complexity in order to meet the needs of all of your students!These Graphing Worksheets include activities to:Practice reading and interpreting pictographsPractice reading and interpreting bar graphsPractice sorting by sizePractice sorting by commo
Subjects:
Grades:
Not Grade Specific
Types:
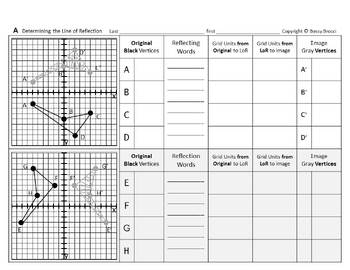
Transformations Slides 07: Determine the Line of Reflection & Write Commands
From the Author of Bossy BrocciMath & Big Science workbooks on Amazon,comes student fillable editable interactiveGoogle Slides™ for Google Classroom™ Students can insert/overlay text & graphics[textboxes, shapes, lines, arrows, colors etc.]onto the G-Slide image backgroundorConvert to PDF, then make it interactive onlineby using various third-party Ed. websitesorPrint it for paper worksheetsAnswer KEY included=======================Students will:1) Determine or Identify 8 Lines of Refle
Grades:
Not Grade Specific
Types:
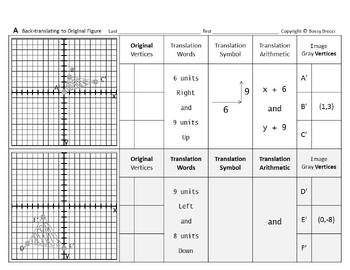
Transformations Slides 04: Graph Reverse Translations from New Image to Original
From the Author of Bossy BrocciMath & Big Science workbooks on Amazon,comes student fillable editable interactiveGoogle Slides™ for Google Classroom™ Students can insert/overlay text & graphics[textboxes, shapes, lines, arrows, colors etc.]onto the G-Slide image backgroundorConvert to PDF, then make it interactive onlineby using various third-party Ed. websitesorPrint it for paper worksheetsAnswer KEY included=======================Students will:1) Perform & Plot/Graph 8 Back- or Re
Grades:
Not Grade Specific
Types:
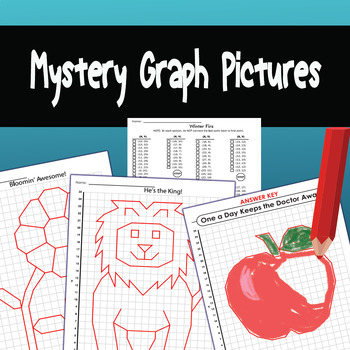
Mystery Picture Graphs Activities Bundle. Challenging Graph Art
Mystery picture worksheets. Student plot the points on the graph paper and connect the lines to make a picture. These can be used to teach coordinate grids and ordered pairs.❤️ Students will love this collection of 27 mystery pictures that are made by coloring in the correct squares on the alphanumeric grid using the coordinates given.❤️ These are great to go with a math/graphing unit, or just to use for when students finish work early. My students always love doing these, and they're also gre
Grades:
Not Grade Specific
Types:
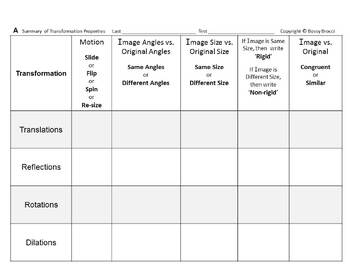
Transformations Slides 23 Translation Reflection Rotation Dilation Properties +Q
From the Author of Bossy BrocciMath & Big Science workbooks on Amazon,comes student fillable editable interactiveGoogle Slides™ for Google Classroom™ Students can insert/overlay text & graphics[textboxes, shapes, lines, arrows, colors etc.]onto the G-Slide image backgroundorConvert to PDF, then make it interactive onlineby using various third-party Ed. websitesorPrint it for paper worksheetsAnswer KEY included=======================Students will:1) Summarize the Properties or Effects of
Grades:
Not Grade Specific
Types:
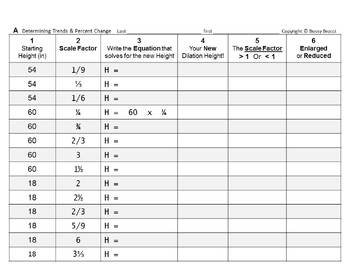
Transformations Slides 21: Calculate Percent Change from Dilations + QUIZ
From the Author of Bossy BrocciMath & Big Science workbooks on Amazon,comes student fillable editable interactiveGoogle Slides™ for Google Classroom™ Students can insert/overlay text & graphics[textboxes, shapes, lines, arrows, colors etc.]onto the G-Slide image backgroundorConvert to PDF, then make it interactive onlineby using various third-party Ed. websitesorPrint it for paper worksheetsAnswer KEY included=======================Students will:1) Write 14 equations that solve for new
Subjects:
Grades:
Not Grade Specific
Types:
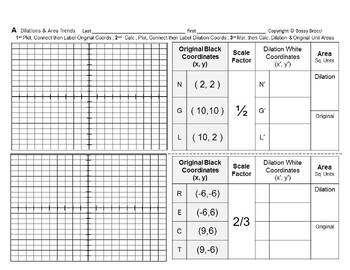
Transformations Slides 20: Graph Dilations Calculate Area Change & Trends + QUIZ
From the Author of Bossy BrocciMath & Big Science workbooks on Amazon,comes student fillable editable interactiveGoogle Slides™ for Google Classroom™ Students can insert/overlay text & graphics[textboxes, shapes, lines, arrows, colors etc.]onto the G-Slide image backgroundorConvert to PDF, then make it interactive onlineby using various third-party Ed. websitesorPrint it for paper worksheetsAnswer KEY included=======================Students will:1) Plot, Color, Label, Write & Calcul
Grades:
Not Grade Specific
Types:
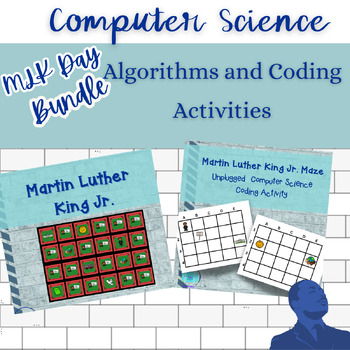
Martin Luther King Jr. Day Computer Science Activities Bundle
Do you need computer science algorithms and coding activities? Are you looking for a fun way to incorporate coding and teach about Martin Luther King Jr. in your classroom?This bundle includes my Maze and Racing Game Activities with Martin Luther King Jr themes.Maze activities teach algorithms and the importance of step-by-step instructions. Students help a character complete tasks on a grid, followed by writing a program.The racing game format allows multiple students to play, creating differen
Grades:
Not Grade Specific
Types:
CCSS:
NGSS:
3-5-ETS1-3
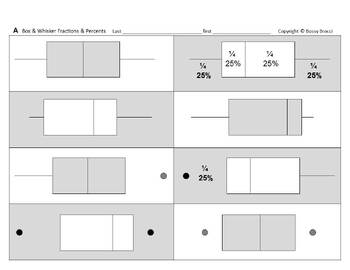
Stats&Data Slides 08: Convert Label Box and Whisker Plots to Fractions Percents
From the Author of Bossy BrocciMath & Big Science workbooks on Amazon,comes student fillable editable interactiveGoogle Slides™ for Google Classroom™ Students can insert/overlay text & graphics[textboxes, shapes, lines, arrows, colors etc.]onto the G-Slide image backgroundorConvert to PDF, then make it interactive onlineby using various third-party Ed. websitesorPrint it for paper worksheetsAnswer KEY included=======================Students will:1) Analyze 16 Box & Whisker Plots (Bo
Subjects:
Grades:
Not Grade Specific
Types:
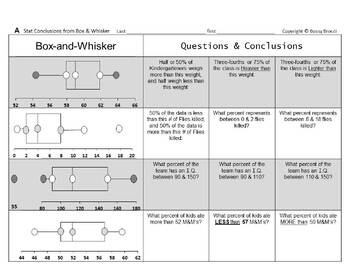
Stats&Data Slides 09: Statistical Conclusions from Box and Whisker Plots QUIZ
From the Author of Bossy BrocciMath & Big Science workbooks on Amazon,comes student fillable editable interactiveGoogle Slides™ for Google Classroom™ Students can insert/overlay text & graphics[textboxes, shapes, lines, arrows, colors etc.]onto the G-Slide image backgroundorConvert to PDF, then make it interactive onlineby using various third-party Ed. websitesorPrint it for paper worksheetsAnswer KEY included=======================Students will:1) Analyze 8 Box & Whisker Plots (Box
Subjects:
Grades:
Not Grade Specific
Types:
Showing 1-24 of 132 results


