134 results
12th grade test preparation graphing resources for Microsoft Excel
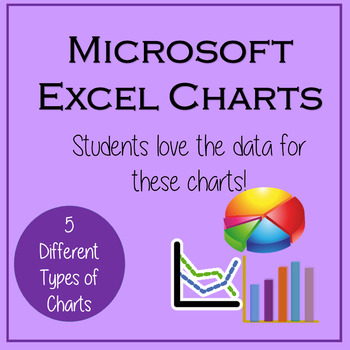
Excel Lessons - Creating Charts
No Prep! These lessons are great as a first Excel Chart lesson or for students already a little familiar with creating charts. Students love the data for these charts because the data is centered around things they love – their cell phones! In Lesson 1, students will create 5 different charts from step-by-step directions which include Chart Titles, Chart Styles, Axis Titles, Data Labels, and Moving Chart to its own Sheet.In Lesson 2, students will create 5 charts from provided data as well as ch
Grades:
5th - 12th
Types:
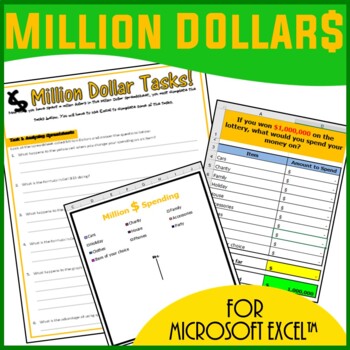
Excel Spreadsheets Million Dollars Activity
This resource allows students to understand the following: How graphs change when spreadsheet data is alteredUse of SUM() functionsHow graphs are madeComponents of a graphAdvantages of spreadsheets over pen and paper methodsStudents use this resource to understand how altering data in spreadsheets allow graphs to change. They understand such concepts by trying to spend a Million Dollars in a minute. Students are then expected to complete the associated worksheet which accompanies the spreadsheet
Grades:
5th - 12th, Adult Education
Types:
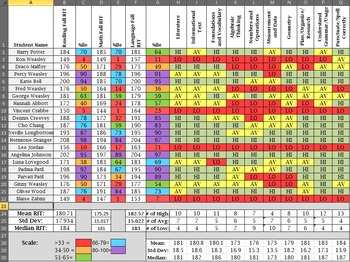
MAP Data Organizer
This is a great resources for teachers and data interventionists because it gathers the MAP data and it compacts everything into a color-coded document! What teacher doesn't love color-coded documents? This excel sheet set comes with an instructional page and 4 other Excel tabs. The tabs are broken down into MAP fall data, MAP Winter data, MAP Spring data, and MAP overall. On the MAP data pages, you will import your class roster, RIT scores for Reading, Math, and Language, and percentiles.The ex
Subjects:
Grades:
K - 12th
Senior Checklist for High School (College Prep, Military, Workplace)
Check out this great resource for high school seniors! High school counselors, this is a collaborative tool to share with your students and parents as you help your seniors stay on track to graduate. This is a Google Sheets product that has 4 main tabs:1. College Checklist (FAFSA links, ACT/SAT prep & testing, college planning, etc.)2. Military Checklist3. Apprenticeship Checklist4. Workforce Entry Checklist
Grades:
11th - 12th, Higher Education, Adult Education, Staff
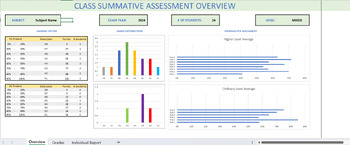
Leaving Certificate Assessment Tracker
Save time and make tracking student's progress easily.Once you have added the student names, simply input assessment name and the grade achieved. All the rest will be automatically generated!Each page has simple instructions provided to ensure ease of use - No Excel skills required.Once off payment - simply create a copy of the file for each new class.With the Leaving Certificate Assessment Tracker you will easily be able to do all of the following:Overview page:See a class overview based on you
Grades:
4th - 12th
Types:
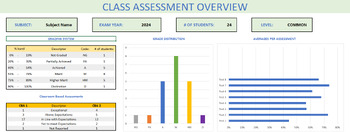
Junior Cycle Assessment Tracker
Save time and make tracking student's progress easily. Once you have added the student names, simply input assessment name and the grade achieved. All the rest will be automatically generated!Each page has simple instructions provided to ensure ease of use - No Excel skills required.Once off payment - simply create a copy of the file for each new class.With the Junior Cycle Grade Tracker you will easily be able to do all of the following:Overview page:See a class overview based on your classes
Grades:
4th - 12th
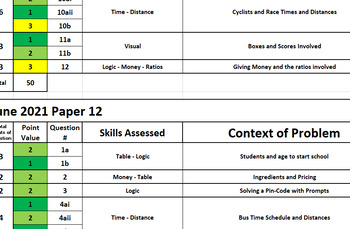
AICE Thinking Skills - Curriculum and Exam Breakdowns
(This product had originally been mistakenly uploaded incorrectly and then fixed but the negative review has never been taken down)This product includes a day-by-day breakdown of an entire First Semester, which covers all skills involved for AS level except the writing application needed in questions #2 and #5 on Paper 2. It includes all AS level Problem Solving Skills for Paper 1, as well as the AS level skills needed for questions #1, #3 and #4 (RAVEN, Main Conclusion, Intermediate Conclusion,
Grades:
8th - 12th, Higher Education
Types:

Parabola Transformations - Interactive
A handy guide to help new students learn how each change affects the shape and direction of parabolas. Clear color coding for the various pieces of the formula and instant updates help separate and isolate the concepts for easy, intuitive learning.Enter information using simple dropdown menus and organized blank fields to isolate each piece of the formula!Two tabs:One allows you to enter individual pieces of information to show the resulting formulaOne allows you to enter the formula to show the
Subjects:
Grades:
7th - 12th, Higher Education, Adult Education
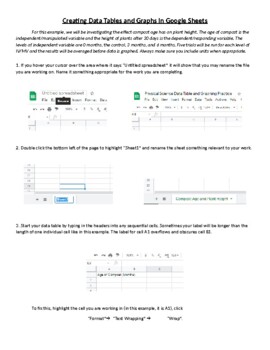
Creating Data Tables and Graphs in Google Sheets
This is an activity that walks students through the process of organizing and entering data into a data table and then using that data to generate line, bar, and pie charts. Once the graphs are generated, the process of formatting and editing the different parts of each graph is explained.
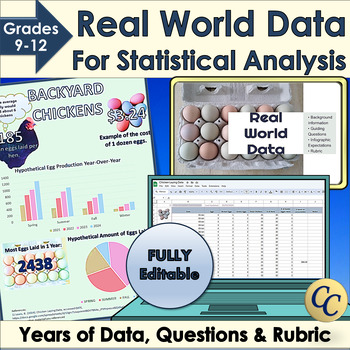
Real World Data for Statistical Analysis and Infographic Project
Give your students access to real world data for your statistical analysis unit or data literacy! Dive into statistics with Microsoft Excel™ or Google Sheets™ and years of data. Learn how to use standard deviation, mean or median to interpret data. Choose the best graphs to display conclusions in an infographic. Works great for science fairs! ✔ Includes an infographic project! (Template, expectations, and rubric). ✔ Everything is fully editable and you and your students can even use the images
Grades:
9th - 12th
Types:
CCSS:
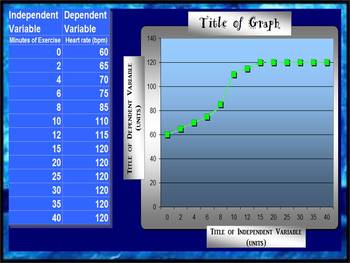
LINE GRAPH MAKER (AUTOMATIC)
This spreadsheet allows you to insert your independent and dependent variables into a chart and voila!... a line graph is generated as you enter in each piece of new data! Students love to take their data from a lab and watch as a graph is made right before their eyes! You can change all of the titles on the chart and the graph to suit your classes laboratory experiment needs! Students can easily print out their data to include in their lab reports!
Grades:
2nd - 12th
Types:
Printable Graph Paper 10 Squares Per Inch Cross Stitch
Printable Graph Paper 10 Squares Per Inch Cross Stitch - Grid paper is essentially the type of paper most commonly used for drawing and sketching purposes. It is widely used for making plan charts, designing websites, developing home ideas and so forth. A great deal of businesses who need to produce a company card, business brochures, catalogues, brochures, and so forth need this kind of graph paper.
Subjects:
Grades:
5th - 12th
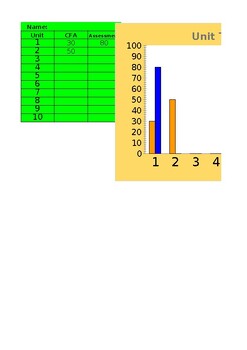
Unit Test Tracker/Reflection
Tired of printing graphs and reflection sheets for the students to track their growth? Students can now track their own growth from one unit to the next throughout the year using this digital tracker. Each unit reflection is tabbed on the bottom of the sheet. I use this as google sheet where the student can make their copy and save it under their google drive.
Grades:
4th - 12th
Types:
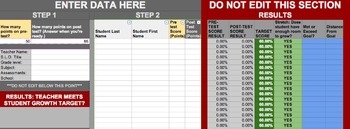
SLO GROWTH TARGET CALCULATOR, OHIO
The SLO target calculator is a useful Google spreadsheet that calculates all your student-growth targets automatically (Excel version available). Using a “close the gap by half” model, this spreadsheet takes the guessing game out of setting growth targets for students. It assigns an aggressive, yet attainable goal. Example: If a student scores 50% on their SLO pre-test, they should score 75% by the end of the year. Example: If a student scores 30% on their SLO pre-test, they should score 60%
Grades:
PreK - 12th
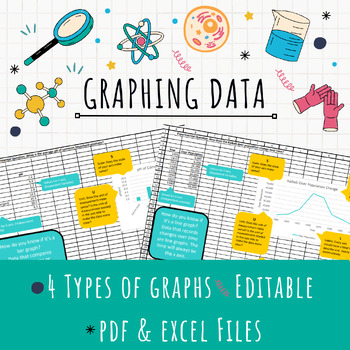
EDITABLE Excel Graphing Template
Teach graphing in Excel with this EDITABLE template! After collecting data, have your students represent it in a formal graph using Excel. This template provides helpful tips for students to determine the right kind of graph (bar, line, or pie) for their data and ALSO teaches them all the important parts of a graph.Assign the template for students to download and edit for a quick graphing solution or provide the pdf handouts for students who just need a little guidance!4 different kinds of graph
Grades:
7th - 12th
Types:
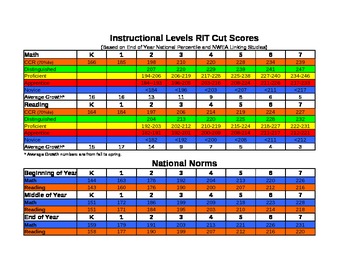
Universal AssessmentNORMS AND CUT SCORES
This NWEA MAP testing tool is used within our district. This tool is linked to numbers from the NWEA ACT Study and NWEA KPREP Study. If you do not live in the state of Kentucky you can still find a study correlating MAP RIT to achievement on your state's test and adjust the numbers. This tool is great for goal setting because it gives the average growth numbers and each student's goal before the next test should be to improve to the next color. The colors are also an excellent visual to hang
Grades:
K - 12th
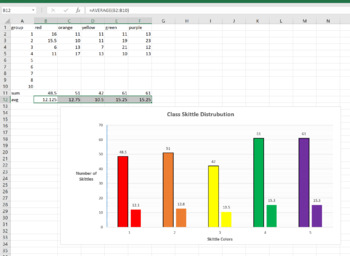
Skittle Statistics MS Excel Mini-Lab
This is a 1 class MS Excel lab for a computer or math class. You can have the students explore the distribution of different color Skittles in class. This is a great mini-lab or half-day activity when you school ends up with a weird schedule day. Tell them they can't eat till the Skittles till the end of class, or they will distort their numbers. Also make sure they don't throw them or shove them up their nose (Yes, stuck Skittles are hard to extract, ask me how I know..)The goal of this lab is
Grades:
6th - 12th, Higher Education, Adult Education
Types:
NGSS:
MS-ETS1-2
, HS-ETS1-2
, HS-ETS1-3
, MS-ETS1-4
, MS-ETS1-1
...
Also included in: Hands-on Science Semester Labs Bundle
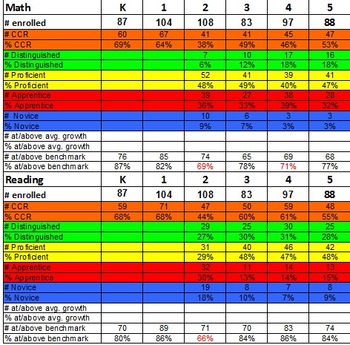
Universal Assessment Data Analysis Tool
This tool can be used to analyze district-wide, school-wide, or classroom MAP data. Simply input your data and automatically get percentages toward each instructional level (used in conjuction with MAP Testing Norms and Cut Scores, a free tool!). The percentage meeting benchmark is particularly useful because any grade with less than 75% of students at benchmark indicates a core instruction problem. Make sure your school, classroom, district is on track! Using the MAP reports feature in an Exc
Subjects:
Grades:
K - 12th
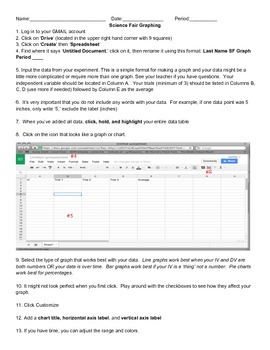
How To Graph Using Google Spreadsheets
This is a step-by-step guide on how to use Google Spreadsheets for students in grades 5-12. Use this as a resource when guiding students through the process. Included with the directions is sample data for students to use when practicing graphing. Perfect for science experiments and science fair!
Subjects:
Grades:
5th - 12th
Types:
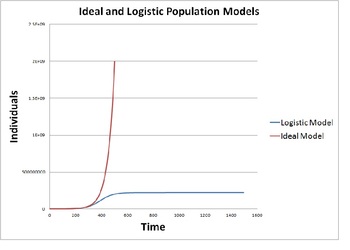
Modeling Population Growth (Ideal vs. Logistic Model)
This activity provides instructions to construct a mathematical model on a blank spreadsheet that simulates population growth using an ideal model and a logistic model. The activity provides background discussion and then gives instructions on how to program a spreadsheet to produce and display the ideal and logistic population models. Their results are studied for various cases including human population, rabbits, polar bears, bacterial and yeast colonies.
This quantitative population model
Subjects:
Grades:
9th - 12th, Staff
Types:
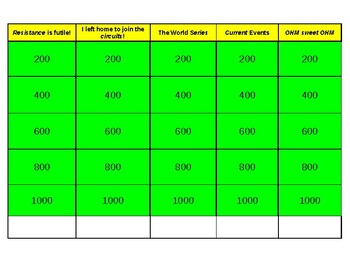
Series and parallel circuits review, EXCEL jeopardy-style game
This game allows students to review "simple circuit" vocabulary and practice problems including both series and parallel resistor circuits, using a answer-question, jeopardy-type model. Answers/questions involve Ohm's law (voltage, current and resistance concepts), power equations, and associated units.The game can be played during class, with student groups, or as a "remote learning" tool for students to review both qualitative and quantitative concepts, independent of the classroom setting. Th
Subjects:
Grades:
7th - 12th, Higher Education, Adult Education
Types:
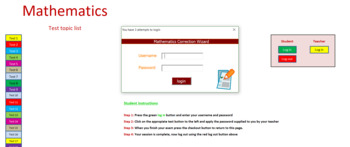
Mathematics Correction Wizard v1.0.0.1 - Pernament License
Hello and welcome, let me quickly explain to you all about the Mathematics Correction Wizard.The purpose The Mathematics Correction Wizard has been designed to save you time. Sitting behind your desk endlessly correcting exams is no fun and a waste of your valuable time which could be put too much better use within the classroom.Within the Mathematics Correction Wizard, you set up your tests as required along with setting up any follow up work which students must do in the event of non completio
Subjects:
Grades:
6th - 12th, Higher Education, Adult Education, Staff
Types:
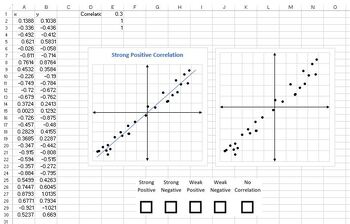
Correlation Graph Generator
Have you ever wanted to generate randomized scatter plots for images to use in class notes, assignments, or tests? Look no further! This spreadsheet generates high resolution scatter plots with each of the following relationships:- Strong Positive Correlation- Weak Positive Correlation- Strong Negative Correlation- Weak Negative Correlation- No CorrelationEach scatter plot is formatted in two ways:- With graph title and line of best fit (for instruction)- With no title or line of best fit (for
Subjects:
Grades:
9th - 12th
Student Grade & Skills Check-In Questionnaire | All Subjects Reflection Form
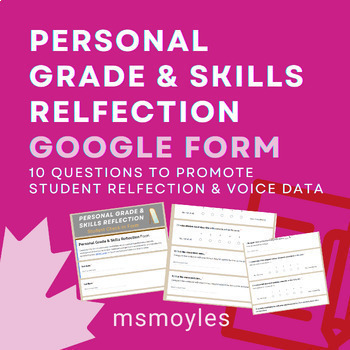
Purpose: This personal student reflection form is useful to provide learners a way to reflect on their: personal grade in your courselearning skills and executive functioning (as practiced in your class or term)evaluations of what your course could use "more of" and "less of" (i.e. this is an excellent student-voice data collection strategy or way to refine/improve a course or its content/assessments)Instructions for Learners: Complete this form to share your meditations on your personal perform
Subjects:
Grades:
5th - 12th
Types:
Showing 1-24 of 134 results


