
Box and Whisker Plot Digital and Print Card Sort - Reading and Analyzing


- Zip
- Google Apps™
- Internet Activities
- Microsoft OneDrive

What educators are saying
Also included in
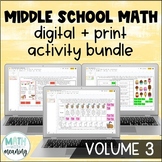 Looking for a set of no-prep, engaging digital and print activities? This bundle contains 20 digital and printable activities on various middle school math topics for use on Google Drive or Microsoft OneDrive! You will save 30% by buying this bundle rather than buying each activity individually!PleaPrice $35.00Original Price $50.00Save $15.00
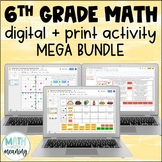 Looking for a year-long set of no-prep, engaging digital activities for sixth grade math? This bundle contains 35 Digital and Printable Activities (plus a BONUS activity) on various 6th grade math topics for use on Google Drive or Microsoft OneDrive! No cutting or gluing necessary! You will save ovePrice $56.00Original Price $81.50Save $25.50
Description
Looking for an engaging, no-prep activity to practice reading and analyzing box plots? Students will look at a double box plot and determine if statements about it are true, false, or if they can't tell from the information given in this fun digital and print activity.
This activity includes statements about the minimum, maximum, median, quartile 1 (Q1), quartile 3 (Q3), interquartile range (IQR), and range of the box plots, along with statements about the percentages represented by a particular portion of the data. Please view the preview file to make sure that this activity is appropriate for your students.
This product includes the following:
- A link to the activity on Google Slides including student directions
- A PowerPoint version of the activity that can be uploaded to OneDrive
- A printable version of the activity (also available separately)
- Detailed directions for how to share the activity with students including video tutorials for both Google Drive and Microsoft OneDrive
- An optional recording sheet
- An optional Google Form for self-checking/easy grading along with a tutorial
- Answer key
This activity is aligned to CCSS 6.SP.B.4 and 6.SP.B.5.C.
Please note that this activity is NOT editable. The text, problems, and images are not able to be changed.
Want to try before you buy? You can get two free digital activities by signing up here!
***************************************************************************
You May Also Like:
- Better Buy Taco Tuesday DIGITAL Drag and Drop Activity
- Two-Step Equations Matching Activity
- Combining Like Terms (With Integers) Scavenger Hunt Activity
- Solving Inequalities Matching Activity
- Integer Operations Activity Bundle
***************************************************************************
How to get TPT credit to use on future purchases:
- Go to your My Purchases page. Beside each purchase you'll see a Provide Feedback button. Simply click it and you will be taken to a page where you can give a quick rating and leave a short comment for the product. Each time you give feedback, TPT gives you feedback credits that you use to lower the cost of your future purchases. I really appreciate your feedback, as it helps me to design resources that meet the needs of my customers!
Be the first to know about my new discounts, freebies and product launches:
- Look for the green star next to my store logo and click it to become a follower.
- New products are discounted for the first 24 hours!
Connect with me!
- Check out my blog for classroom ideas and tips!
- Follow me on Instagram to see daily life in my middle school math classroom!
©Google LLC All rights reserved. Google Drive, Google Slides, and Google Forms are trademarks of Google LLC.
