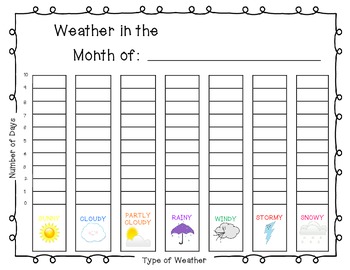
Weather Bar Graph
Anna Rogowski
70 Followers
Resource Type
Standards
CCSS1.MD.B.3
CCSS2.MD.D.10
CCSS3.MD.B.3
Formats Included
- PDF
Pages
1 page
Anna Rogowski
70 Followers
What educators are saying
So cute and engaging. We live in Texas so more sunny day options would be nice. Or an option to have editable spots.
Description
- Use this weather bar graph to collect daily data about the weather as part of your calendar routine. Save all the completed bar graphs and at the end of the school year have students analyze the data. Which month was the sunniest? How many more days did it rain in October than September? etc.
- Use it during your common core unit on data.
Graphics from: www.mycutegraphics.com
- Use it during your common core unit on data.
Graphics from: www.mycutegraphics.com
Total Pages
1 page
Answer Key
N/A
Teaching Duration
Lifelong tool
Report this resource to TPT
Reported resources will be reviewed by our team. Report this resource to let us know if this resource violates TPT’s content guidelines.
Standards
to see state-specific standards (only available in the US).
CCSS1.MD.B.3
Tell and write time in hours and half-hours using analog and digital clocks.
CCSS2.MD.D.10
Draw a picture graph and a bar graph (with single-unit scale) to represent a data set with up to four categories. Solve simple put-together, take-apart, and compare problems using information presented in a bar graph.
CCSS3.MD.B.3
Draw a scaled picture graph and a scaled bar graph to represent a data set with several categories. Solve one- and two-step “how many more” and “how many less” problems using information presented in scaled bar graphs. For example, draw a bar graph in which each square in the bar graph might represent 5 pets.


