17 results
Middle school statistics poster microsofts
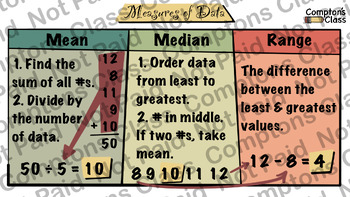
Compton's Class Data And Statistics 6th Grade Math Package
5 Anchor Charts that deals with Data and Statistics.
Subjects:
Grades:
6th
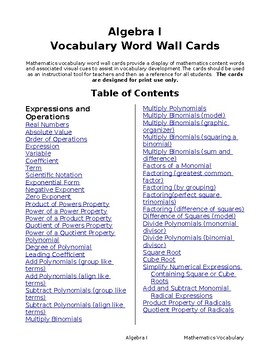
Algebra I Vocabulary Posters (110 Pages )
Looking for a quick and easy way to practice Math Vocabulary?These colorful and concise Posters and Flashcards are a great way to reinforce math concepts. Hang on a bulletin board and keep on a ring for reviewing.
Subjects:
Grades:
6th - 12th, Higher Education, Adult Education
Types:
Math Vocabulary Posters & Flash Cards for grade 8(Editable & fillable resource)
Looking for a quick and easy way to practice Math Vocabulary?These colorful and concise Posters and Flashcards are a great way to reinforce math concepts. Hang on a bulletin board and keep on a ring for reviewing.
Subjects:
Grades:
7th - 9th
Types:
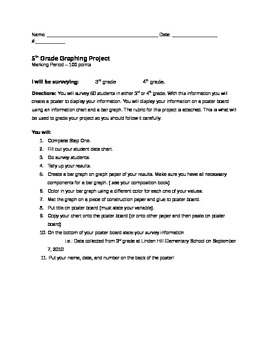
Graphing and Surveying Project
A graphing and Surveying Project for students to get a better idea of how to create different types of graphs. I have used this with fourth and fifth grades and it was fantastic!
The attachment includes: Step by Step directions for the project, a brainstorming sheet, a chart to take the survey on, a written response sheet, and a rubric to grade students.
Graphing and Surveying Project is licensed under a Creative Commons Attribution 3.0 United States License.
Subjects:
Grades:
3rd - 6th
Types:
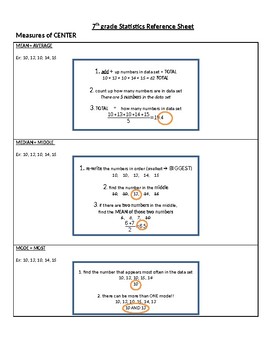
7th grade Statistics - Unit Reference
2018-2019 7th grade statistics unit reference guide. Supporting mastery of grade level objectives. Students will be able to define what makes a strong statistical sample, students will compare related data sets to draw conclusions about past trends and make predictions for the future, students will represent data sets visually through box plots, histograms, and other graphical tools, and utilize these in combination with numerical statistical measures in order to support their conclusions and
Subjects:
Grades:
6th - 8th
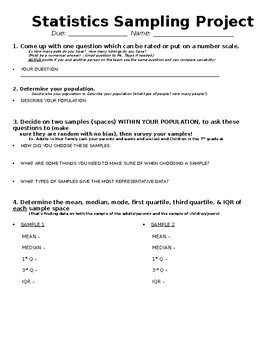
Statistics Sampling Project
An editable project where students will conduct a survey to conclude an outcome. Students will need to provide and explain their sample spaces, means, medians, modes, interquartile ranges, and IQRs, as well as construct dot plots and box plots on the data. The project comes with a rubric (broken down in points out of 100) on the project itself! I had students show work on a poster board, however, most of this work could be done on paper if you wished!
Subjects:
Grades:
5th - 10th
Types:
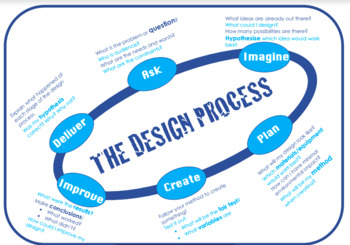
Design Process/Cycle
A design process/cycle to support students through their next science, design and technology or engineering unit of inquiry.
This resource can be edited to support all student's needs, curriculum links and teaching styles.
Each stage of the design process is aligned with questions to prompt students and promote deeper thinking.
Literacy links can be made with writing scientific experiments, procedural texts, and explanation texts. Numeracy links can be made to data collection, representation
Subjects:
Grades:
3rd - 10th
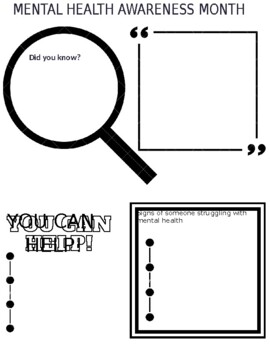
Mental Health Awareness Poster
A poster students can create to promote Mental Health Awareness around school. Fits perfectly with May Mental Health Awareness Month
Subjects:
Grades:
2nd - 12th, Staff
Types:
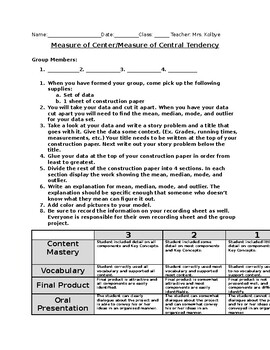
Measure of Center Practice
Here is an activity you can do with your students after introducing mean, median, mode, and outlier. It is designed to be a group assignment they can complete in one class period. I had my students present them the following class period. You can make up your own data set.
Subjects:
Grades:
5th - 7th
Types:
Box and Whisker Plots PPT Notes
Box and Whisker Plots, Power Point Presentation, Notes
Subjects:
Grades:
6th - 9th
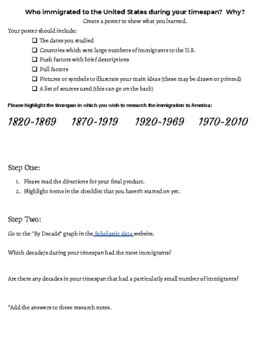
USA immigration timespan project
Have students investigate real statistics about immigration to the United States of America from its conception to modern day. Students will engage with stats that teach them about which specific countries sent large numbers of immigrants to the USA. Then, students will research any push factors that led to immigrants wanting to leave their country for the USA.
Grades:
7th - 8th
Types:
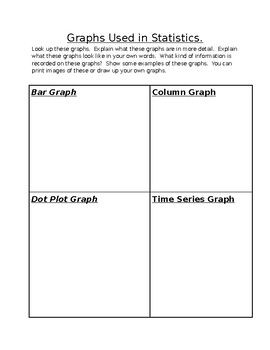
Graph Comparisons
Great Inquiry on the different types of graphs used in Statistics.
Subjects:
Grades:
3rd - 6th
Types:
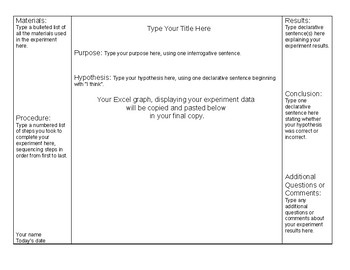
Scientific Method Mini Trifold Board Template
Students can create mini trifold boards, to display any science experiment using the Scientific Method format with this Word document template.
Teachers can save and share this with their students using public file storage available on school servers, Google Drive, etc.
This classroom-tested template was used for a Valentine Candy Heart Investigation project I developed. Student sample work may be viewed on my classroom web site here:
http://www.mrsdingman.com/Vday_Mini_Tri-Fold_Julia.pdf
htt
Subjects:
Grades:
5th - 8th
Types:
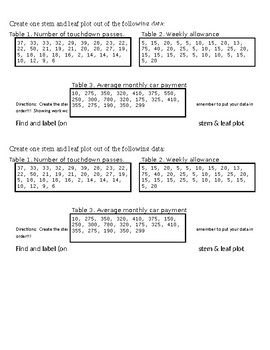
Stem and Leaf Football
Students will create their own stem and leaf plot using the data given. The directions are attached...poster paper, rulers and colored utensils will be needed!!Great for subs, days with a half of your classes or just plain ole' review!
Subjects:
Grades:
6th - 8th
Types:
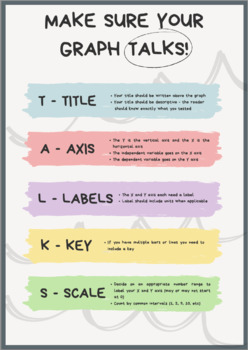
Graph Checklist
Graph checklist for your students to follow! Easy acronym for them to remember.
Subjects:
Grades:
5th - 7th
Types:
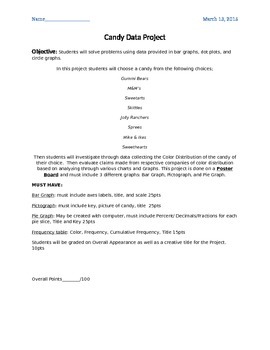
Candy Graphing Project
Students use a candy of their choice and display their data using different types of graphs and charts
Subjects:
Grades:
6th - 7th
Types:
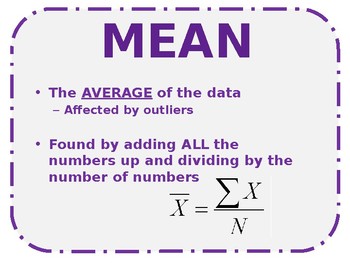
Central Tendency Posters
Posters to print out to put around the classroom to explain measures of central tendency (mean, median, mode, range, standard deviation, IQR)
Subjects:
Grades:
6th - 12th
Types:
Showing 1-17 of 17 results


