117 results
Statistics unit plans $10 and up
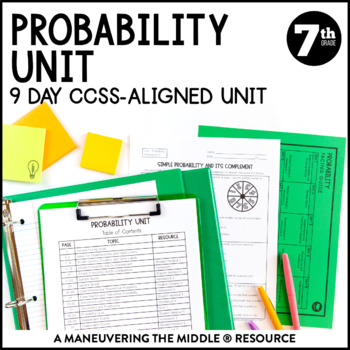
Probability Unit | Independent and Dependent Events | 7th Grade Math Notes
A 9 day CCSS-Aligned Probability Unit - including simple probability, experimental and theoretical probability, making predictions, and independent and dependent probability.Students will practice with both skill-based problems, real-world application questions, and error analysis to support higher level thinking skills. You can reach your students and teach the standards without all of the prep and stress of creating materials!Standards: 7.SP.5, 7.SP.6, 7.SP.7, 7.SP.8; Texas Teacher? Grab the T
Subjects:
Grades:
7th
Types:
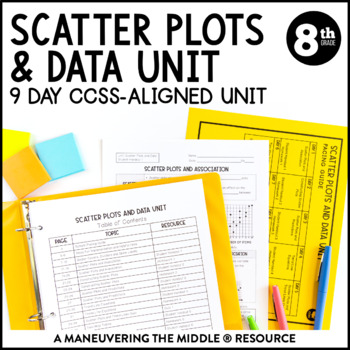
Scatter Plots and Data Unit | 8th Grade Math | Line of Best Fit Notes
A 9 day CCSS-Aligned Scatter Plots and Data Unit - including scatter plots, trend lines, two-way tables and relative frequency.Students will practice with both skill-based problems, real-world application questions, and error analysis to support higher level thinking skills. You can reach your students and teach the standards without all of the prep and stress of creating materials!Standards: 8.SP.1, 8.SP.2, 8.SP.3, 8.SP.4; Texas Teacher? Grab the TEKS-Aligned Scatter Plots and Data Unit. Please
Subjects:
Grades:
8th
Types:
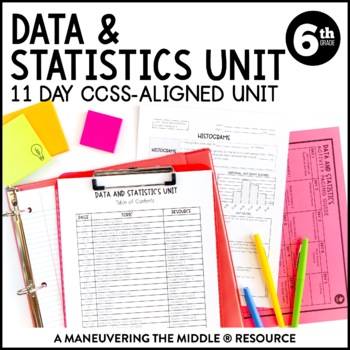
Data & Statistics Unit | Measures of Center, Dot and Box Plots, & Histograms
An 11 day CCSS-Aligned Statistics Unit - including statistical questions, describing data, and analyzing data with dot plots, box plots, and histograms. Students will understand measures of center and variability and how they relate to displays of data. Students will practice with both skill-based problems, real-world application questions, and error analysis to support higher level thinking skills. You can reach your students and teach the standards without all of the prep and stress of creatin
Subjects:
Grades:
6th
Types:
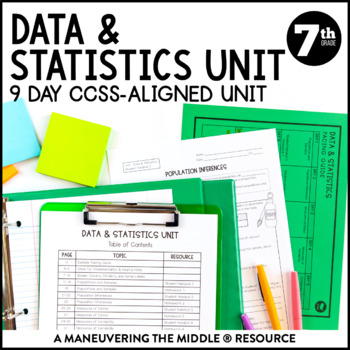
Data and Statistics Unit | Random Sampling, Dot Plot, & Box Plot 7th Grade Notes
A 9 day CCSS-Aligned Statistics Unit - including populations and samples, drawing inferences from samples, measures of centers and variability, comparing and analyzing dot and box plots. Students will practice with both skill-based problems, real-world application questions, and error analysis to support higher level thinking skills. You can reach your students and teach the standards without all of the prep and stress of creating materials!Standards: 7.SP.1, 7.SP.2, 7.SP.3, 7.SP.4; Texas Teache
Subjects:
Grades:
7th
Types:
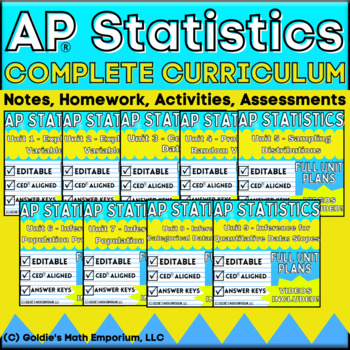
Goldie's FULL CURRICULUM for AP® Statistics
AP® Statistics Full CurriculumIn this product, you will receive all of Goldie's products related to AP® Statistics. All 9 units follow the College Board's© CED and include the following:Student Guided NotesStudent notes are "fill in the blank" style notes; teachers lead the lesson and work with students to complete the content. All content from the AP® CED is included and taught in the notes for this curriculum.Content VideosEach set of notes has a video to accompany it, where I teach the lesson
Subjects:
Grades:
10th - 12th
Types:
CCSS:
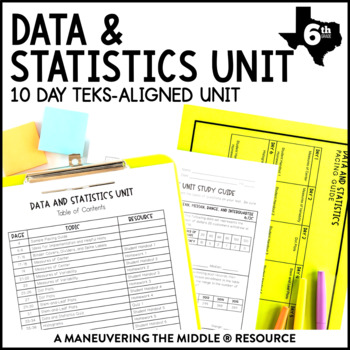
Data and Statistics TEKS Unit | Stem & Leaf Plots, Histograms, Frequency Tables
A 10 day Data and Statistics TEKS-Aligned complete unit including: measures of center, measures of variability, dot plots, stem-and-leaf plots, histograms, and categorical data.Students will practice with both skill-based problems, real-world application questions, and error analysis to support higher level thinking skills. You can reach your students and teach the standards without all of the prep and stress of creating materials!Standards: TEKS: 6.12A, 6.12B, 6.12C, 6.12D, 6.13A, 6.13B; Lookin
Subjects:
Grades:
6th
Types:
Goldie’s AP® Statistics UNIT 1 PLANS – Exploring One Variable Data
AP® Statistics Unit 1 – Exploring One Variable DataUnit BundleThis unit contains everything you need to teach "Exploring One Variable Data" in AP® Statistics or regular-level Statistics. Students will go through how to represent quantitative and categorical data with various graphs and tables; find and interpret various measures of center and spread; and calculate and compare positions and percentiles in a normal distribution. This unit is part of my larger unit bundle: Goldie's AP® Statistics F
Subjects:
Grades:
10th - 12th
Types:
CCSS:
Also included in: Goldie's FULL CURRICULUM for AP® Statistics
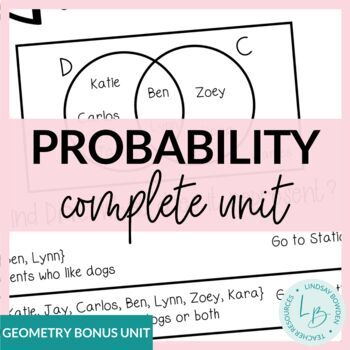
Probability Unit Bundle
Get a complete High School Compound and Conditional Probability unit including lessons on set theory, outcomes, and basic, compound, and conditional probability, and more! These ready-to-use resources include everything you need to teach high school probability to your on-level or lower-level/special education class. Supplements would be needed for an honors class.This is a bonus unit that's included in my Geometry Curriculum.Each unit contains guided notes, practice worksheets for the classroo
Subjects:
Grades:
9th - 11th
Types:
CCSS:
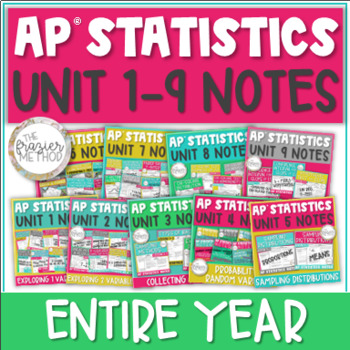
AP Statistics Notes Curriculum ENTIRE YEAR Units 1-9 Notes with Keys
121 PAGES of AP Statistics Notes to teach through ALL 9 UNITS over the ENTIRE YEAR in your AP Stats class! Histograms, box plots, scatterplots, linear models, residual plots, linear regression computer output, sampling methods, bias, experiment design, probability rules, random variables, binomial distributions, sampling distributions of proportions and means, chi-square distribution, confidence intervals, hypothesis tests, TI-84 Plus CE calculator functions, and so much more! Aligns with the AP
Subjects:
Grades:
10th - 12th
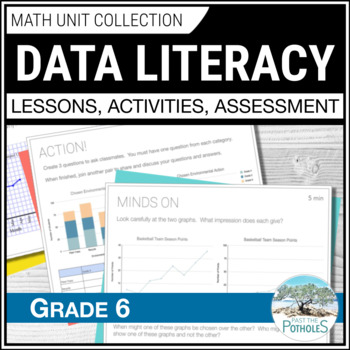
Data Management Unit: Reading Graphs Collecting & Analyzing Data Grade 6 Ontario
Save time and reduce stress!! This UPDATED Grade 6 Ontario Math Data Literacy unit has EVERYTHING YOU NEED. Students will learn about reading graphs, collecting data, analyzing data, misleading graphs, averages, and more. It includes 3-part Google Slides lessons, worksheets, games, centres, assessments, and report card comments. New histograms, broken-line graphs and infographic content are included with data analysis and data collection! SPECIFIC LESSON TOPICS:✓ Discrete and Continuous Data✓
Subjects:
Grades:
5th - 7th
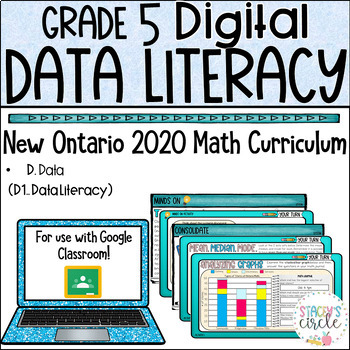
Grade 5 NEW Ontario Math Data Literacy Unit Digital Slides
This resource includes a comprehensive and engaging Grade 5 Ontario Math Data Literacy Unit including 3-part lessons, skill practice, self-grading assessment, and social emotional learning. This unit covers EVERY SPECIFIC Expectation from the 2020 Ontario D1. Data Literacy Strand. WHY BUY THIS PRODUCT OVER OTHERS?My vision for teaching math is always "Don't just tell the story, let the students experience the story first hand. HOW?Students will be walked through curriculum concepts step-by-step
Subjects:
Grades:
4th - 6th
Types:
Goldie’s AP® Statistics UNIT 2 PLANS – Exploring Two Variable Data
AP® Statistics Unit 2 – Exploring Two Variable DataUnit BundleThis unit contains everything you need to teach "Exploring Two Variable Data" in AP® Statistics or regular-level Statistics. Students will go through how to create, calculate, and compare numerical and graphical representations for two categorical variables; represent and describe bivariate quantitative data using scatterplots; calculate and interpret a linear regression model; use residuals and residual plots; and explore transformed
Subjects:
Grades:
10th - 12th
Types:
CCSS:
Also included in: Goldie's FULL CURRICULUM for AP® Statistics
Goldie’s AP® Statistics UNIT 6 PLANS – Inference for Proportions
AP® Statistics Unit 6 – Inference for Categorical Data: ProportionsUnit BundleThis unit contains everything you need to teach "Inference for Categorical Data: Proportions" in AP® Statistics or regular-level Statistics. Students will go through how to justify conditions, calculate, interpret, and justify a claim about a confidence interval for a population proportion; identify the relationships between sample size, the width of a confidence interval, confidence level, and margin of error for a po
Subjects:
Grades:
10th - 12th
Types:
CCSS:
Also included in: Goldie's FULL CURRICULUM for AP® Statistics
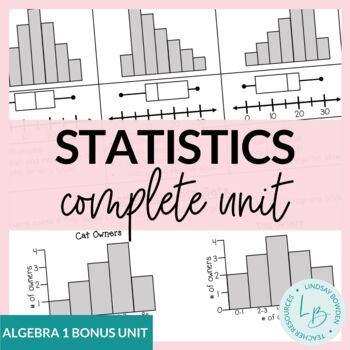
Statistics Unit Bundle
This is a complete statistics unit for an Algebra 1 course. All assessments (quizzes, study guide, and test) are editable to fit your needs. This unit is included in my Algebra 1 Curriculum.*Note: This unit is best suited for on-level or lower-level/special education math classes. Supplements will most likely be needed for an honors or upper-level math class.*This unit now contains video lessons for every lesson!*Topics Covered:Mean, Median, Mode ReviewStem and Leaf PlotsHistogramsDot PlotsRange
Subjects:
Grades:
8th - 10th
CCSS:
Grade 6 Data Literacy 2020 Ontario Math Digital Google Slides : D. Data
This resource includes a comprehensive and fully hands-on and interactive unit covering the entire Data Literacy strand from the Grade 6 New Ontario Math Curriculum. (D1.1-D1.6). WHY BUY THIS PRODUCT OVER OTHERS?My vision for teaching math is always "Don't just tell the story, let the students experience the story first hand. HOW?Students will be walked through curriculum concepts step-by-step in easy-to-understand language using identifiable and relatable problems.Rather than mostly instruction
Subjects:
Grades:
5th - 7th
Types:
Also included in: Grade 6 Ontario Math Curriculum FULL YEAR Digital Slides Platinum Bundle
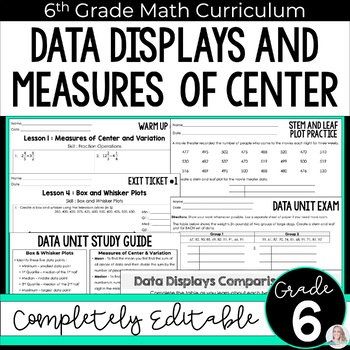
Data Displays Unit 6th Grade Math Curriculum
6th Grade Data Unit - Completely editable to help you best meet the needs of your students!Click here to purchase the digital notebook version of this unit. 6th Grade Math Curriculum Unit 7 {Buy the full curriculum HERE}This unit includes five multi-day lessons that the following skills :Measures of Center and VariationLine Plots and Stem and Leaf PlotsFrequency Tables and HistogramsBox and Whisker PlotsCharacteristics of Data DisplaysIncluded in this resource: Google Forms versions of the asses
Subjects:
Grades:
6th
Also included in: 6th Grade Math Curriculum: Comprehensive, Engaging & Standards-Aligned
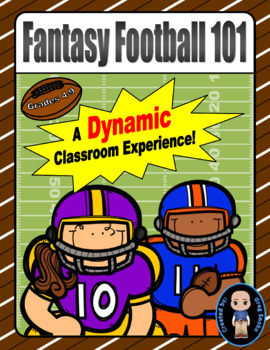
Fantasy Football 101 (2023)
The 2023 Update is Here!Are you ready for some football? How about some football with a 21st Century mathematical twist? Fantasy Football 101 is a highly enjoyable opportunity for your students to collaborate, create, communicate, and think critically while managing an imaginary professional football team. Let me help you to bring the fun, excitement, and camaraderie of this dynamic experience into your classroom.Fantasy football is an activity my students have participated in, and thoroughly en
Subjects:
Grades:
4th - 9th
Types:
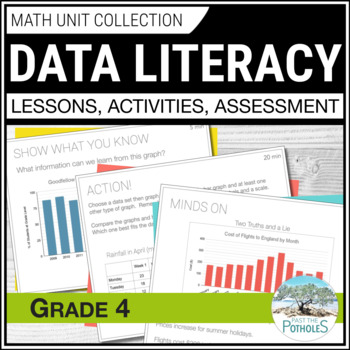
Grade 4 Ontario Data Management Unit Collecting Data Reading Graphs Infographic
Save time and stress! This COMPLETE Data Literacy unit includes EVERYTHING YOU NEED to guide students with collecting data, analyzing data, reading graphs, finding averages. It includes 3-part math Google Slides lessons, projectable slides for following along, taking notes, and creating anchor charts. It also includes practice worksheets, review activities, math centres, assessments, and Ontario math report card comments. Lesson topics: ❉ Describe and Compare Qualitative & Quantitative D
Subjects:
Grades:
3rd - 5th
Types:
CCSS:
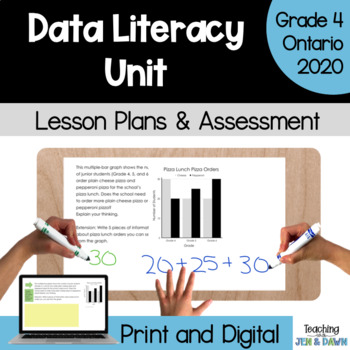
Grade 4 Data Literacy Unit - Ontario Math 2020 - PDF and Google Slides
Make teaching data literacy (data, mean, median, mode, analysing and creating graphs) easy for you and engaging for your students! This detailed unit has several 3-part lessons and investigations that lead students to learn about data literacy using problem solving, exploration, and mathematical discussions. It also includes an assessment package - summative task, unit review, test, and rubrics. And yes, Google slides are included too! Here's what you'll get:3-part lesson plans and student in
Subjects:
Grades:
4th
Types:
Also included in: Grade 4 ALL RESOURCES BUNDLE - Ontario 2020 Math (Full Year)
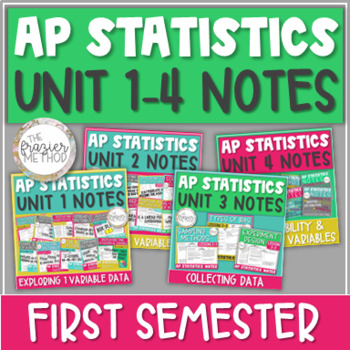
AP Statistics Notes Unit 1-4 Graphs, Linear Regression, Experiments, Probability
64 PAGES of AP® Statistics Notes! UNITS 1, 2, 3, & 4 - the entire FIRST SEMESTER of AP® Stats! Unit 1 includes histogram, box plot, median, mean, standard deviation, interquartile range, Normal Distribution, z-score... Unit 2 covers two way table, scatterplot, linear model, residual plot, correlation coefficient, linear regression computer output... Unit 3 has sampling methods, bias, experiment design... Unit 4 covers basic probability rules, compound probability of multiple events, conditio
Subjects:
Grades:
10th - 12th
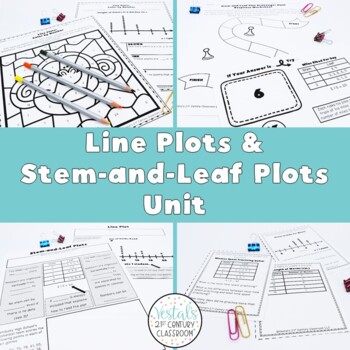
Line Plots and Stem-and-Leaf Plots Lessons (Math SOL 5.PS.1)
Are you looking for no-prep lessons and activities to teach line plots and stem-and-leaf plots? Look no further! These Line Plots and Stem-and-Leaf Plots Lessons provide everything you need to teach creating, interpreting, and comparing line plots and stem-and-leaf plots. Save time planning and your students will love completing the hands-on activities found in this unit.To take a closer look at some of the things included in this unit, check out the preview!What will students learn through thes
Subjects:
Grades:
5th
Types:
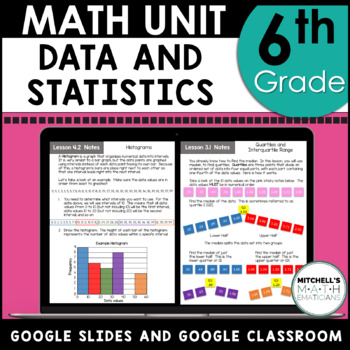
6th Grade Math Data and Statistics Curriculum Unit 7 Using Google
In this NO PREP Google Drive product you get an entire unit that covers: statistical questions; categorical and numerical data; frequency tables; line plots; dot plots; mean, median, mode, and range; outliers; quartiles and interquartile range (IQR); mean absolute deviation (MAD); bar graphs; histograms; box-and-whiskers plots; and much more . All you have to do is share the file with your students and they can get started. Text boxes are included so your students know where to type their answer
Subjects:
Grades:
6th - 7th
Types:
Also included in: 6th Grade Math Curriculum Bundle CCSS Aligned
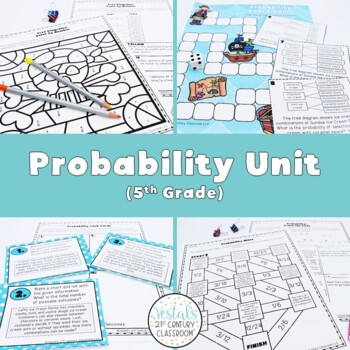
Probability Unit Plans (Math SOL 5.PS.3) {Digital & PDF Included}
Are you looking for no-prep lessons and activities to teach probability and sample spaces? Look no further! These Probability Unit Plans provide everything you need to teach probability with tree diagrams, lists, charts, and the Fundamental (Basic) Counting Principle. Save time planning and your students will love completing the hands-on activities found in this unit.To take a closer look at some of the things included in this unit, check out the preview!What will students learn through these de
Subjects:
Grades:
5th
Types:
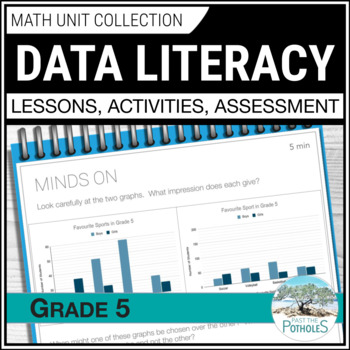
Data Management Unit: Reading Graphs Collecting & Analyzing Data Infographics
Save time and reduce stress!! This UPDATED Data Literacy unit has EVERYTHING YOU NEED. Students will learn about reading graphs, collecting data, analyzing data, misleading graphs, averages, and more. It includes 3-part Google Slides lessons, worksheets, games, centres, assessments, and report card comments.LOCK IN THIS PRICE! **You will have FREE LIFETIME UPDATES for any future updates and additions.**Lesson topics: ❉ Collecting Data using Sampling techniques ❉ Organizing Data using frequenc
Subjects:
Grades:
5th - 6th
Types:
Showing 1-24 of 117 results


