44 results
High school Autumn statistics rubrics
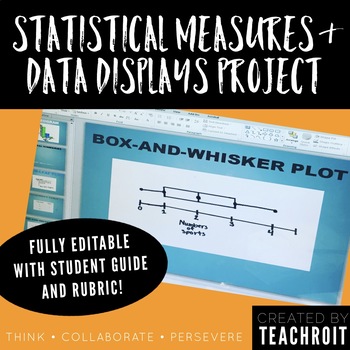
Statistics & Data Display Project for 6th Grade Math PBL (Fully Editable)
This product includes a student guide for a 6th grade middle school mathematics project that will require students to develop a statistical question, conduct a survey with their classmates, create numerical summaries, represent their findings using visual data displays, and finally present their findings! The thorough student guide provides step by step directions for each part of the project and could be used as either an in class project or to be assigned as homework. The student guide also in
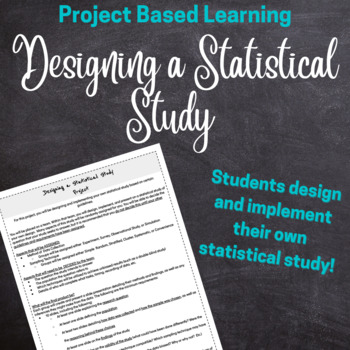
Statistics Project Design and Implement a Statistical Research Study Project
Prove that your students know how a good statistical or research study is designed! In this project, students will be assigned a method of data collection (either Observational Study, Experiment, Survey, or Simulation) and a sampling technique (either cluster, stratified, simple random, systemic, or convenience) and will design their own research question and study. The goal is for students to develop a research question that works well with the method of collection and sampling technique they w
Subjects:
Grades:
11th - 12th, Higher Education, Adult Education
Types:
Project. Misleading Graphs Analysis Write Up with Rubric
Students will watch the TEDTalk How to spot a misleading graph - Lea Gaslowitz then do some research to find misleading graphs in the media!Objective. Students will research TWO misleading graphs, then create a google doc with those graphs and provide a written analysis. This is an individual assignment. Opportunity to explain...- Cherry Picking- Vertical axis manipulation- Horiztonal axis proportion- the author's motivation to graphically manipulate dataRubric is provided.
Subjects:
Grades:
8th - 12th
Middle School Survey Statistics Project Bundle
DescriptionA bundle of all materials needed for my Middle School Survey Project! Perfect for an end of year or statistics unit project.A fun, engaging, and active way for students to explore the foundations of statistical analysis and modeling.In this project students are tasked with creating a statistical question, surveying two relevant populations, calculating the measures of center and variability, making a dot plot, histogram, and box-and-whisker plot, and analyzing their data.Included in t
Subjects:
Grades:
6th - 9th
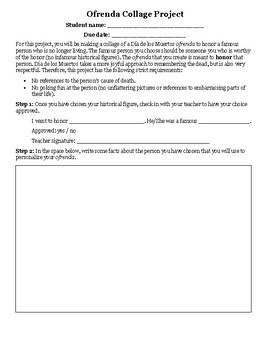
Día de los Muertos - Day of the Dead - Ofrenda Project
Día de los Muertos, or Day of the Dead, is a joyous celebration of loved ones who have passed away. For this project, students create a collage ofrenda, or altar, to honor a famous person who has died. In the process, they learn about the traditional items included in an ofrenda, as well as the ways that these beautiful displays are personalized to reflect the things that the deceased person enjoyed. I have used this assignment in my classroom, and it has provided an opportunity for students to
Subjects:
Grades:
7th - 10th
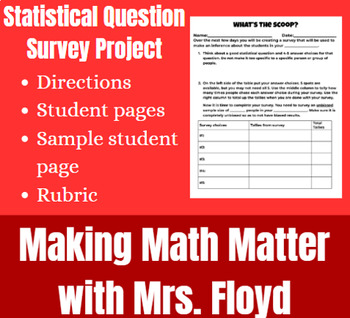
Statistical Question Survey Project
Students will be creating their own statistical questions to survey students in their grade (or school if you have a small school), the sample, and make an inference about all of the students in their grade(or school), the population. This would be great to either go along with the unit, right after, or at the end of the year for a review project. See the preview of what a project could look like for a student.Page with description, materials needed, and directionsStudent pagesSample student pag
Subjects:
Grades:
6th - 10th
Types:
Also included in: Statistics Activities Bundle
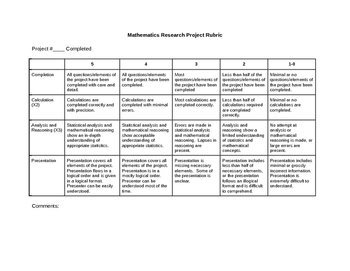
Math or Statistics Research Project Rubric
This editable rubric contains fields for project completion, calculation, analysis and reasoning, and presentation on a scale of five to one. It was originally designed for the Alberta Math 20-2 mathematics research project requirement, but is suitable for use across junior and senior high.
Subjects:
Grades:
9th - 11th

Probability for grades 6-10
This packet will guide you into putting on a school wide carnival with games of chance. I have been doing this for 15 years and it is always a success. The Rubric for the final project is included along with experiments.
Subjects:
Grades:
6th - 10th
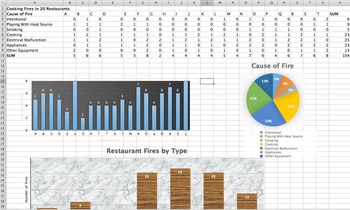
Statistics Project Unit 3 Spreadsheets Mean Median Mode Std. Deviation (2 day)
This is a 1-2 day project aimed at introducing a statistics class to Excel (or Numbers) who are familiar with Pie Charts, Bar Charts, Measures of Central Tendency, and Standard Deviation. The students will input data (included) into Excel (on fires in restaurants), form their own Bar Charts and Pie Charts, and be able to input formulas into the Excel to automatically calculate statistics. Students will be given the opportunity to explore different charts and design their charts to make them colo
Subjects:
Grades:
9th - 12th, Higher Education, Adult Education
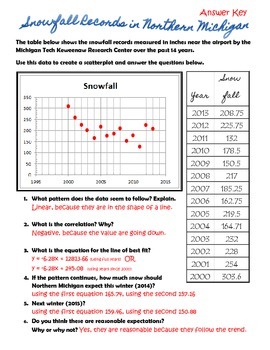
Scatter Plot Prediction Worksheet Answer Key
This is the answer key to my free download!
Subjects:
Grades:
9th - 12th
Types:
Analyzing Misleading Graphs
Students are to find a graph online. They are given a url and other resources on how to find it. From there, they are to write a paragraph analyzing the validity of the graph. They are to include the title, resource, what the article is trying to convey, how it is/is not misleading, and at least two suggestions on how to make the graph more clear. Since this is a web-based assignment, it would be perfect for distance learning. Included:Student directions (in word doc so editable for your classro
Subjects:
Grades:
7th - 12th
Types:
CCSS:
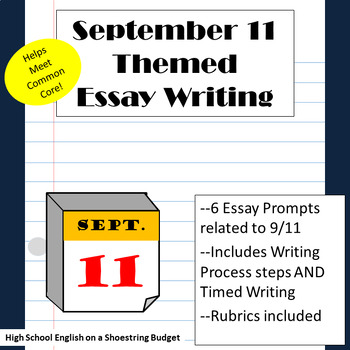
September 11 (9/11) Themed Essay Writing, w Rubrics & Printables
The September 11th (9/11) Essay Writing bundle includes 6 different prompts. There are two prompts each for expository, persuasive and narrative essay writing. In addition to the prompts, there are instructions on using it as a demand or timed writing prompt (great for use with a Substitute teacher) as well as a planned essay writing assignment using the writing process. Rubrics included. This activity includes infinitely re-usable resources for both demand/ timed writing as well as the wri
Subjects:
Grades:
8th - 11th, Adult Education
Types:
Also included in: A Year of Themed Essay Writing, Super Bundle w Rubrics & Printables
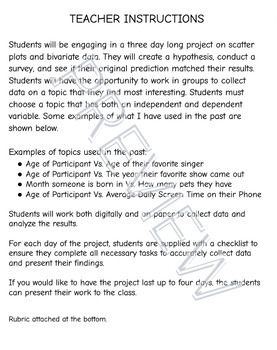
Scatter Plot and Bivariate Data Project
Students will be engaging in a three day long project on scatter plots and bivariate data. They will create a hypothesis, conduct a survey, and see if their original prediction matched their results. Students will have the opportunity to work in groups to collect data on a topic that they find most interesting. Rubric attached at the bottom.
Subjects:
Grades:
6th - 12th
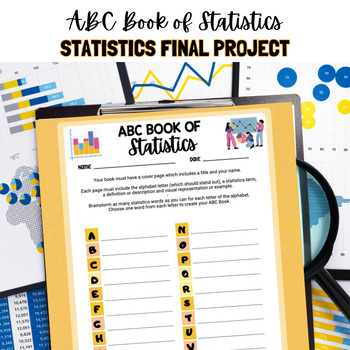
ABC Book of Statistics
Looking for a Cumulative Project for Your Statistics Class?This ABC Book gives students an opportunity to search and review statistics terminology from throughout the course. Students use the brainstorm sheet to write down statistics vocabulary words for each letter of the alphabet. Students will then create an ABC book. A sample page is provided (Z is for Z-Score!) A 15 point rubric is also included for this Statistics Project!
Subjects:
Grades:
9th - 12th
Types:
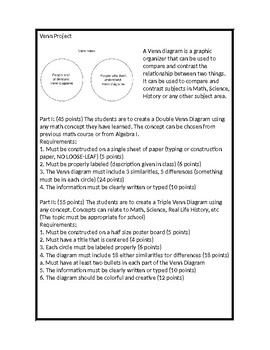
Venn Diagram Project
A Venn diagram is a graphic organizer that can be used to compare and contrast the relationship between two things. It can be used to compare and contrast subjects in Math, Science, History or any other subject area.
Subjects:
Grades:
3rd - 12th
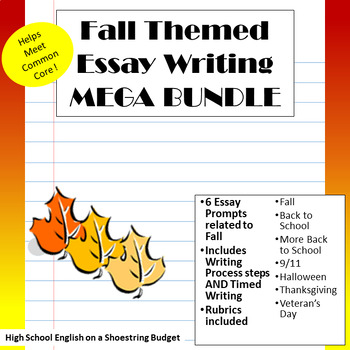
Fall (Autumn) Themed Essay Writing MEGA BUNDLE w Rubrics & Printables
The Fall (Autumn) Themed Essay Writing Mega Bundle includes 36 different prompts. It includes the following products:Fall (Autumn) Themed Essay Writing BundleBack to School Themed Essay WritingMORE Back to School Themed Essay WritingHalloween Themed Essay Writing BundleThanksgiving Themed Essay Writing BundleSeptember 11th (9/11) Themed Essay WritingVeterans' Day Themed Essay WritingThere are prompts for expository, persuasive and narrative essay writing. In addition to the prompts, there are
Subjects:
Grades:
8th - 11th, Adult Education
Types:
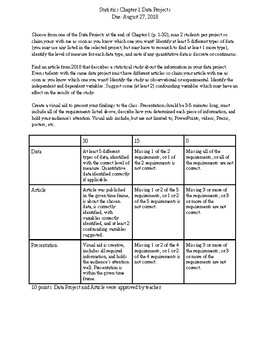
Bluman Statistics Chapter 1 Project
This is an end of Chapter 1 project aligned with the Bluman Statistics textbook, focussing on types of data, levels of measure, quantitative vs qualitative, continuous vs discrete, observational vs experimental, independent vs dependent variables, and confounding variables. It is a word document, so changes can be made for your individual class. Grading rubric is included.
Subjects:
Grades:
11th - 12th, Higher Education
Types:

PBL Math project Education vs. Wages
The information provided is a guide to giving your students some freedom and choice in a project based on seeing the value of education in their future.
Subjects:
Grades:
4th - 9th
Types:
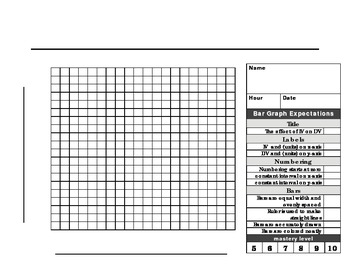
Bar Graph paper and rubric
This 20 X 20 graph paper with rubric is made for a beginner scientist to make a the perfect BAR graph. The checklist format makes it easy for students to know what is expected when graphing. Enjoy!
Subjects:
Grades:
1st - 12th, Higher Education, Adult Education
Types:
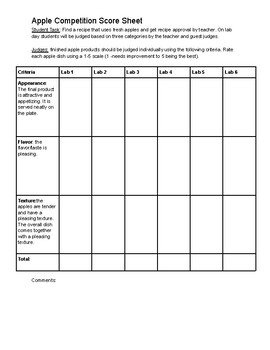
Apple Competition Score sheet | Family Consumer Science
In my foods classes we get a bunch of free apples. With them we do one lab that is a "competition" that is judged by guest teacher judges. I have students get into lab groups and then find a recipe that uses apples. They get their recipe approved by me and then they lab plan, etc. This resource is for the day of the lab for the judges to score each group. It has three categories that they are judging and then I total up all the points and declare a winner for the competition.
Subjects:
Grades:
7th - 12th
Types:
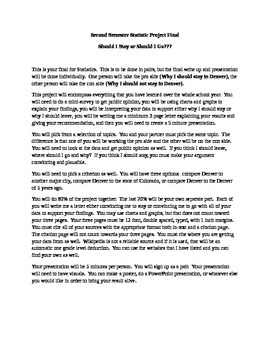
Should I Stay or Should I Go?
This is a statistics project that can be adapted to any grade level. This particular one is for already set up for a high school statistics class. This comes with websites for the students to use, three rubrics for grading, complete instructions, and sample topics. This project has been successful in my classroom. My students have been able to take everything that they have learned from the whole year and combine it into one project. It is a great project as a final!
Subjects:
Grades:
10th - 12th, Higher Education
Types:
Autumn Activity Packet for French Students
This packet contains 4 different activities related to autumn for French students. Included in the packet:
-Reflection Activity
-Chanson d'Automne poem
-Poem memorization rubric
-Writing prompt with rubric
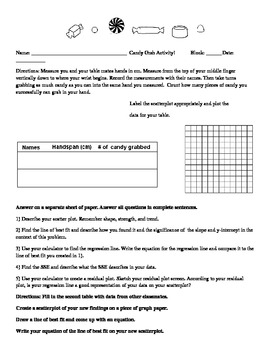
Candy Grab Activity
This activity investigates the relationship between hand size and the number of pieces of candy a student can grab. For this activity I offer students extra points on the activity if they bring a bag of wrapped candy. In this activity they work in groups and come up with the scatter plot, least squares regression line equation and correlation for the data they collect. There is a portion where they calculate the least squares regression line step-by-step. A graphing calculator is necessary for t
Subjects:
Grades:
10th - 12th
Types:
AP Statistics Final Project Rubric
This is a detailed rubric for help in grading the AP Statistics final cumulative project.
The document is in word format so that you can personalize it if desired.
Subjects:
Grades:
10th - 12th
Types:
Showing 1-24 of 44 results


