126 results
High school Autumn statistics laboratories
Thanksgiving Science: 5 Activities & Labs
Included in this package are science activities and printables to excite your students for Thanksgiving! Students will learn/engage in the following activities:Anatomy of a Turkey (NO PREP!) This activity focuses on the body system of a turkey. Students are provided body part names and descriptions. They must match these body parts with their correct location on the body of a turkey.Selective Breeding to Create a "Super Turkey" (NO PREP!) Students observe sets of turkeys with noticeabl
Subjects:
Grades:
5th - 9th
Types:
Also included in: Holiday Science Bundle: Activities for Every Major Holiday
Candy Probability: Discovery of EXPERIMENTAL vs. THEORETICAL Probability
Middle Schoolers LOVE probability!
This is a GREAT lesson around Halloween when the kids are already hyped up on sugar and want to 'talk' to their classmates.
This activity allows the students to DISCOVER the differences between EXPERIMENTAL and THEORETICAL probability and connect it to everyday experiences. The probability lesson lends itself to fractions, decimals, percents, data collection, rational & irrational numbers, statistical graphs (box and whiskers, frequency tables...), measu
Subjects:
Grades:
5th - 9th
Types:
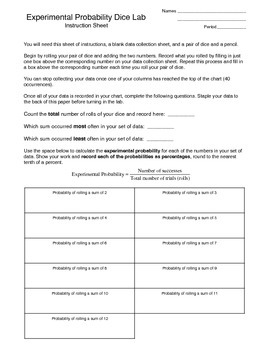
Experimental Probability Activity (dice lab)
In this activity students work with a partner to roll a pair of dice (many times) and record the sum of the dice in a data collection sheet. Once the data has been collected the students are walked through the process of calculating the experimental probability for each sum and then the theoretical probability for each sum and are asked questions about the differences they find between the values. Students also make a bar graph using the percentages for theoretical probability and can visually s
Subjects:
Grades:
7th - 11th
Types:
Theoretical vs Experimental Probability Lab (includes making predictions)
This is a fun, student-centered activity in which students working with a partner will conduct an experimental lab tossing 2 coins. After completing the lab, they will draw conclusions based upon the results of the activity concerning the difference between theoretical and experimental probability. Then they use experimental probability to make predictions. I have included the lab activity, a follow-up worksheet which can be used to engage student discussion after the lab, and a worksheet for
Subjects:
Grades:
6th - 9th
Types:
Leaf Collection Project
A fall leaf collection project to help students practice taxonomy, scientific naming, and presentation skills.
NEW OPTION: SELFIE LEAF COLLECTION! More info below.
Students will collect ten native leaves, use an online taxonomic key to identify the species, and display leaves in a book. Includes student instructions and a grading rubric.
Assign this project at least 3 weeks in advance of the due date. Here in Tennessee, it inevitably rains every weekend during prime leaf-collecting season, so
Subjects:
Grades:
6th - 12th
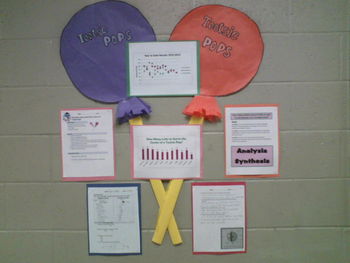
How Many Licks to the Center of a Tootsie Pop? Statistics!
Looking for novel way to get your middle school students excited about math and statistics?!
This file contains everything you need to conduct the experiment (except the Tootsie Pops!) that answers the age old question "How many licks does it take to get the center of a tootsie pop?" The lesson covers mean, median, mode, range, outliers, tables, graphs, box and whisker plots, data collection, pre and post discussion questions, experimental procedures, and student reflection. I also provided a s
Subjects:
Grades:
6th - 9th
Types:
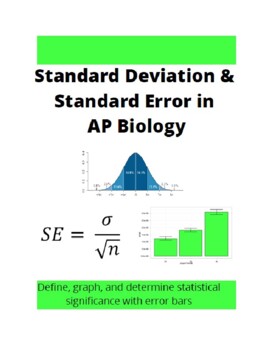
Standard Error and Standard Deviation in AP Biology
Statistics is one of those components in AP Biology that is brand new to students.Without a proper introductory lesson to standard error and standard deviation, students can struggle with this all year. Fortunately, this lesson truly walks your students through the process of defining standard deviation and error, applying the concept of error bars with statistical analysis, and graphing data with error bars to make their own statistical analysis. A PowerPoint is included as well to guide the le
Subjects:
Grades:
11th - 12th
Types:
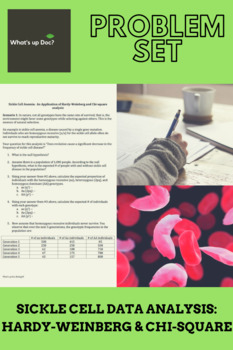
Sickle Cell Data Analysis: Hardy-Weinberg and Chi-Square
Want a great way to convert the "traditional" Hardy-Weinberg lab into a data problem set? Here it is! This is ideal for very small classes, where sample size could be an issue, busy classes, where you may need this for additional at-home practice, or very large classes, where the swapping of H-W cards could get too messy.Included is the full data problem set and teacher pages with the answer key.This data problem set covers:-genotypes and phenotypes-the Hardy-Weinberg equation, with application
Subjects:
Grades:
10th - 12th, Higher Education
Types:
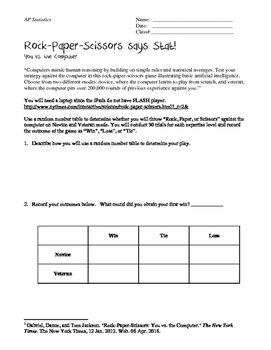
Rock, Paper, Scissors says Stat: A Chi-Square Lab
Students will utilize a Rock, Paper, Scissors website provided by the New York Times to determine whether the computer throwing Rock, Paper, Scissors is truly random. Students are asked to play the game 30 times in both modes. In addition, students are asked to call back ideas of simulation and probability to review previous learned concepts in preparation for the AP Exam to eliminate the confounding variables associated with human behavior.Please find an updated link to the simulator here: ht
Subjects:
Grades:
9th - 12th, Higher Education
Types:
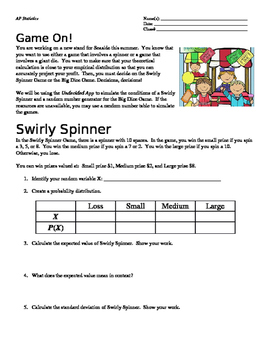
Game On! Hypothesis Testing: 1-Sample t-Test for Means Lab
This lab asks students to apply concepts of 1-sample t-test of means in a real world context. They are able to play/simulate games and determine if their theoretical calculation is accurate.
This lab integrates hypothesis testing based on two carnival games. Spiraling expected value and random variable topics from previous chapters will help themto prepare them with a "big picture" when it comes to the AP Statistics Exam.
(For the high flyers: It also asks students to develop of higher orde
Subjects:
Grades:
10th - 12th
Types:
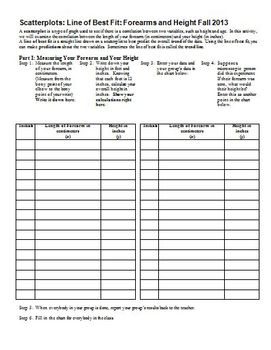
Scatterplots Linear Regression Line of Best Fit Forearms & Height (Editable)
After teaching my students about scatterplots, correlation, and the line of best fit, I take a day for them to do a hands-on lab, in which they measure their height (in inches) and their forearm length (from the tip of their elbow, to the bony point on their wrist), and we plot the class data, write the equation of the line of best fit, and then use the equation generated both forwards and backwards. They will need 45 minutes to an hour to do this in class.
I have found that if the students br
Subjects:
Grades:
7th - 12th
Types:
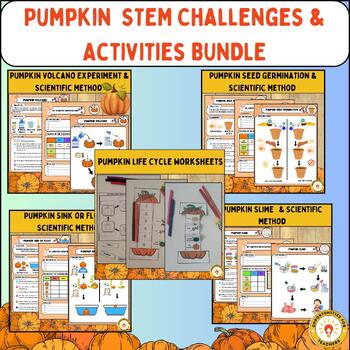
Pumpkin STEM Challenges & Activities BUNDLE
Pumpkin STEM Challenges & Activities BUNDLE - Your Solution to Educational Excitement!Are you searching for an engaging and educational way to captivate your students' curiosity and understanding of the natural world? Look no further! Our Pumpkin STEM Challenges & Activities BUNDLE is the key to unlocking the secrets of pumpkins, offering an exciting, hands-on solution to the question: "What is the problem that this product solves?" - Problem: How can you make learning about the life cyc
Subjects:
Grades:
1st - 9th
Types:
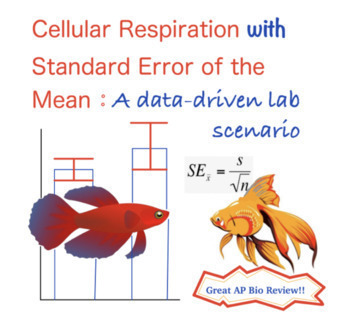
Cellular Respiration Think-it-Through Lab with Standard Error
This activity allows students to review basic concepts of cellular respiration in the context of a lab scenario. Students will work with data and complete calculations including percent change, mean, standard deviation, and standard error. In addition, students will see how error bars are drawn and learn how to interpret them on a graph. Activity A: Introduction (background, lab design, etc)Activity B: Working with data (percent change and mean calculations)Activity C: Calculating standard e
Subjects:
Grades:
9th - 12th, Higher Education, Adult Education
Types:
Also included in: Cell Resp Think-It-Through Lab with Standard Error and Answer Key
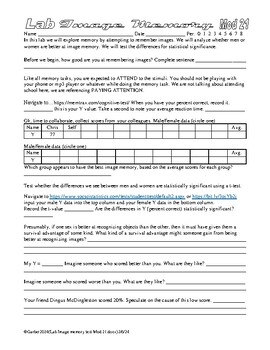
Psychology Lab Image Memory and Sex Differences AP Psychology Statistics
In this set of 13 labs the students do a variety of image memory tasks. They then collaborate and share data, then perform a T test on the data to find out if the differences between the scores of men and women are statistically significant. The students also test for correlations between a variety of scores. I suppose it is a sort of an expansion on my face memory lab. Links sometimes die, so try before you buy… https://www.psychologytoday.com/us/tests/iq/memory-test https://memtrax.com/cogniti
Subjects:
Grades:
9th - 12th, Higher Education, Adult Education
Types:
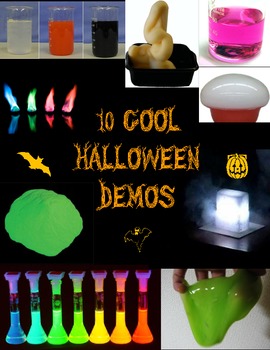
Cool Halloween Science - 10 Demos to wow your Students!
Within you will find 10 activities of such ghoulish cunning, of such frightful delight, that your students will practicaly SCREAM with excitement. They will see colored fire, hear the roar of homemade jet engines, stare in wonder at haunted lights, and feel ghostly slime with their own bare hands!
These activities have been created with the goal of making it easy for you to obtain supplies. You won't need to call up some expensive chemical supply company, most of this stuff can be found in the
Subjects:
Grades:
5th - 12th, Higher Education, Adult Education
Types:
Cell Resp Think-It-Through Lab with Standard Error and Answer Key
This activity allows students to review basic concepts of cellular respiration in the context of a lab scenario. Students will work with data and complete calculations including percent change, mean, standard deviation, and standard error. In addition, students will see how error bars are drawn and learn how to interpret them on a graph.Activity A: Introduction (background, lab design, etc)Activity B: Working with data (percent change and mean calculations)Activity C: Calculating standard error
Subjects:
Grades:
11th - 12th
Types:
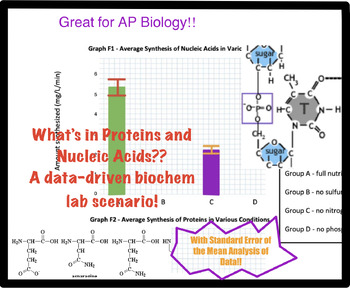
Proteins & Nucleic Acids - What's in Them? Biochem analysis w/ Standard Error
This activity allows students to review basic information related to the 4 classes of biological macromolecules and carbon before exploring the chemical composition of proteins and nucleic acids in this "minds-on" data-driven activity. Students will work with data and complete calculations including percent change, mean, standard deviation, and standard error. In addition, students will see how error bars are drawn and learn how to interpret them on a graph, ultimately reaching conclusions abou
Subjects:
Grades:
9th - 12th
Types:
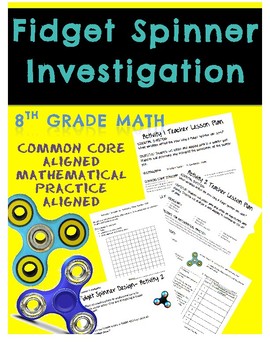
Fidget Spinner Math Investigation Scatter Plots and Data Displays
This pack contains two awesome activities involving the latest fad that is driving teachers CRAZY in middle school classrooms: FIDGET SPINNERS:
TWO Activities are contained in this pack!
Activity 1 is geared towards 8th grade students who have already studied scatter plots and interpreting correlations. In this activity students will collect data and compare the weight and time spinning of a fidget spinner. Materials required: scale, stop watch, and of course fidget spinners!
Activity 2 can b
Subjects:
Grades:
6th - 9th
Types:
CCSS:
WHO'S YOUR DADDY? Corn Genetics Unit WITH Guided Inquiry Lab
50 PAGE Mendelian Genetics Unit with a Guided Inquiry Lab using an optional Chi-Squared Statistical Test.
This can be done as a lab or can just be used as a PowerPoint presentation on Genetics and/or Meiosis.
THIS LAB IS BEST USING THE REAL EARS OF CORN BUT CAN BE DONE WITH THE PHOTOS AT THE END. CORN EARS CAN BE OBTAINED FROM BIOLOGICAL SUPPLY COMPANIES OR YOUR GARDEN. :)
This lab covers the following concepts:
1. Corn Genetics, Monohybrids and Dihybrids
2. Corn (Plant) Reproduction (Ani
Subjects:
Grades:
7th - 12th, Higher Education, Adult Education
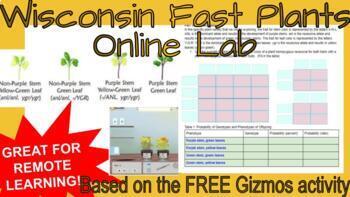
Wisconsin Fast Plants Online Simulation Lab
This comprehensive worksheet has students evaluate genetics using the free online lab through Gizmos (this simulation is currently FREE with the creation of an account (which is also FREE). Students will explore:- tracking parentage based on F1 and F2 phenotypes- statistical analysis using Chi Squared calculations - gene linkage evaluation and gene mapping using recombination frequencies Perfect for remote learning! Everything is included for guided learning AND independent practice to really g
Subjects:
Grades:
9th - 12th, Higher Education, Adult Education, Staff
Types:
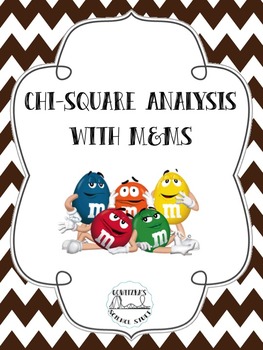
Chi-Square Analysis with M&Ms
Complete Chi-Square Analysis problems with something kids love! M&Ms! This will walk your students through step-by-step to complete a Chi-Square test using Milk Chocolate M&Ms. They will complete individual data as well as class data. Two more pages of additional practice (pea plants) are also included.
I use zip-lock bags (freezer style since they are more durable) and empty one standard size package of M&Ms into it. As long as kids are not too rough with it, it allows you t
Subjects:
Grades:
7th - 12th, Higher Education
Types:
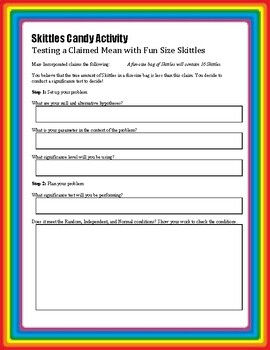
Statistics: Testing a Claimed Mean with Skittles
Each student will need a fun-sized bag of Skittles. They will count the number of Skittles in their bag and along with their classmates' data run a hypothesis test to test if the company's claimed amount of Skittles per bag is correct.
Subjects:
Grades:
10th - 12th
Types:
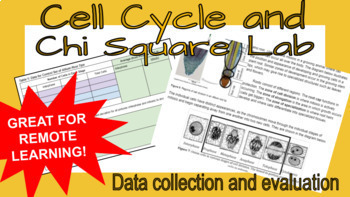
Cell Cycle Experimental Design Online Lab
Use data from real pictures of onion root tips to evaluate the effect of lectin on mitotic rate! A classic AP Biology Lab turned virtual for remote learning. Students use a google slide presentation to collect and share data, perform statistic testing (including standard deviation and Chi Square analysis) before evaluating the true effect of lectin on mitosis!Check out the data collection slides in the preview!
Subjects:
Grades:
9th - 12th, Higher Education, Adult Education, Staff
Types:
Also included in: Chi Square Bundle!

Paper Airplanes: Intro to Statistical Analysis
This is an experiment designed to be part of a Scientific Method unit in a science class. It introduces students to the idea of writing lab reports and using statistical analysis tools such as standard deviation, averages, T-Tests, and Null and Alternative Hypothesis. It can be modified depending on students comfort level with lab report writing and google sheets. There will be a supplemental product that has the Google Sheet Provided.
Subjects:
Grades:
9th - 12th
Types:
Showing 1-24 of 126 results


