Data Management & Analysis Bundle-Pictograph | Bar Graphs | Tally Marks |
- PDF
Description
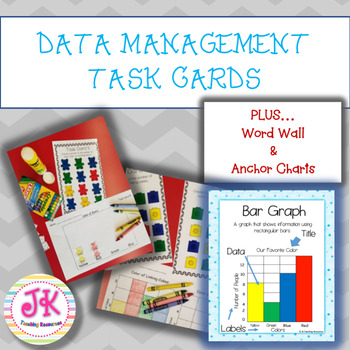
This data management bundle is loaded with over 40 pages of task cards, anchor charts, rubrics AND a word wall! All of which requires very little to NO PREP! It was designed to help teachers teach, reinforce, practice, and assess students’ understanding of the data management/analysis unit.
Our focus was on Grade 2, 3 and special education classrooms when we made this product but it does align with Kindergarten and Grade 1 standards or make a good review in elementary classrooms. Especially for beginning of the data management unit.
It aligns with the common core standards
- K.MD.A.2
- K.MD.B.3
- 1.MD.C.4
- 2.MD.D.10
- 3.MD.B.3
Here is what you get!
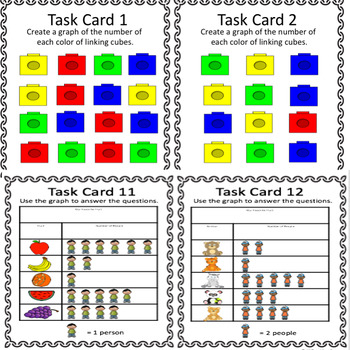
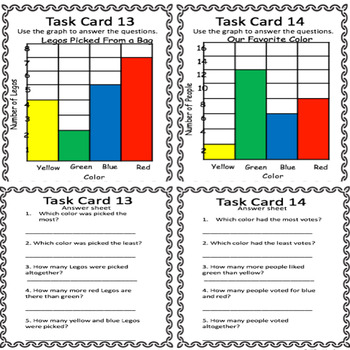
1. 20 Task Cards that focus on…
-constructing bar graphs, pictographs and tally charts
-answering questions by analyzing included graphs/charts
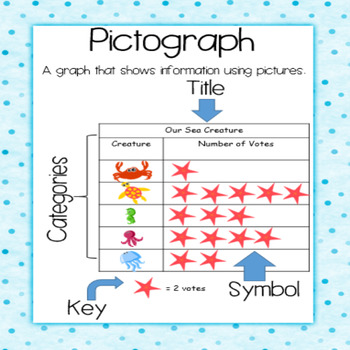
2. 3 Anchor Charts for Tally Charts, Bar Graphs and Pictographs.
3. Data Management Word Wall Words: you get 12 colorful words with pictures.
4. Self Assessment Rubrics for students to assess their skills/knowledge prior to beginning the unit. As teachers we find this very helpful for knowing where our focus should be directed. We also use this rubric after completing the unit to see the progress that student’s feel they made.
Check out our included preview above for further clarity and examples of what is included.
Please click on the ⭐ above to "Follow Us" and receive updates on new products and free downloads when they become available.
Check out one of our best selling math center activity for reinforcing base ten:
⭐ Math Base Ten Robots! Units (ones), Rods (tens) & Flats (hundreds)
⭐ Math Base Ten Robots! Units (ones) & Rods (tens)
Or some of our other products here...
⭐ Count & Match Math Center Games & Activities-Numbers & Pictures to 30! K.CC.B.4
⭐ Kindergarten/Grade 1 Math-Skip Counting Unit! 2,5 & 10, Backward from 20! K.CC.A
⭐ Math Center Missing Number Puzzles to 100. 1 & 10 more, 1 & 10 less 1.NBT.A.1
⭐ Grade Three Math: Fractions Unit BUNDLE Common Core Aligned


