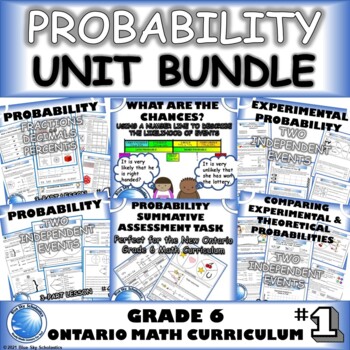
Probability Unit Bundle - NEW 2020 Ontario Math Curriculum Grade 6
- Zip
- Easel Activity
Products in this Bundle (7)
showing 1-5 of 7 products
Bonus
Description
The probability that you have found a comprehensive probability unit is certain! These lessons are designed to have your students use fractions, decimals, percents, and probability lines to represent the probability of events happening. Your students will also develop the skills to use tree diagrams to list all possible outcomes and to determine and compare the theoretical and experimental probabilities of two independent events. By playing several games, they will develop a strong understanding that the more trials done in an experiment, the closer the experimental probability will be to the theoretical probability.
NEW ONTARIO GRADE 6 MATH CURRICULUM:
D2.1
use fractions, decimals, and percents to express the probability of events happening, represent this probability on a probability line and use it to make predictions and informed decisions
D2.2
determine and compare the theoretical and experimental probabilities of two independent events happening
WHAT'S INCLUDED:
Probability as Fractions Decimals Percents - 3 Part Lesson and Riddle Worksheets
- Do you want your students engaged while learning how to express the theoretical probability of events using fractions, decimals, and percents? This 3-part lesson and worksheets begin with a game in which students compare two different events and guess which one is more likely. Next, they are guided through the process of using fractions, decimals, and percentages to express probabilities. Students then try to solve a riddle by calculating the probabilities of 12 different events. You have the option of including movement by printing and posting the events around the classroom.
Using a probability number line to describe the likelihood of an event occurring
- Your students can represent the probability as a fraction or percent and use probability terms to describe the likelihood of an outcome. These worksheets take it one step further by using a number line to match the fractions/percentages representations with the probability descriptions: impossible, unlikely, very unlikely, equally likely, likely, very likely, and certain.
Probability of Two Independent Events and Tree Diagrams Lesson and Worksheets
- This lesson is perfect for teaching your students how to determine the probability of two independent events. First, they are guided through the process of listing all possible outcomes by generating organized lists or tree diagrams. Next, students play a spinner game in which each player scores points based on their assigned outcome. After playing the game, students create a tree diagram and determine the probability of each player being able to score points and win. Students are also provided with several opportunities for independent practice and given questions that assess their ability to find the probability of two independent events.
Experimental Probability of Two Independent Events - 3 Part Lesson & Worksheets
- This lesson engages and guides your students in determining the experimental probability of two independent events. The highly engaging activities included will have them calculate, compare, and examine the differences between theoretical and experimental probability. One activity includes comparing the experimental probabilities of real and fake dice. Another activity includes determining the theoretical and experimental probability of classmates both eating a nasty-tasting jellybean while playing the game BeanBoozled. Students will also love the car race game that allows them to apply their knowledge of odds and probabilities.
Probability of Two Independent Events - Comparing Theoretical and Experimental
- This lesson contains highly engaging activities and worksheets that will have your students compare the theoretical and experimental probabilities of two independent events. By playing games of chance and graphing the outcomes, your students will develop an understanding that the more trials done in an experiment, the closer the experimental probability will be to the theoretical probability.
Probability End of the Unit Summative Assessment Task for Grade 6
- A probability summative assessment that can be used as either an end of a unit assignment or test and aligns with the 2020 Ontario grade 6 math curriculum. Students use fractions, decimals, and percents to express the probability of events happening, represent this probability on a probability line, and use it to make predictions. They will determine and compare the theoretical and experimental probabilities of two independent events happening.
Probability End of the Unit Summative Assessment Task for Grade 7
- A probability summative assessment that can be used as either an end of a unit assignment or test and aligns with the 2020 Ontario grade 7 math curriculum. These tasks will test students' abilities to determine and compare the theoretical and experimental probabilities of two independent events happening and of two dependent events happening.
***************************************************************************
OTHER MATH ACTIVITIES BY BLUE SKY SCHOLASTICS:
- Probability and Frequency Tables - A Problem-Solving Activity
- Comparing Theoretical Probabilities - A Problem Solving Activity
- Converting Fractions to Percentages - A Math Problem Solving Activity
- Using Percent Benchmarks to Estimate Quantities - A Problem-Solving Activity
- Finding the Percent of a Number - A Problem-Solving Activity
- Percentage Bundle - Solving Problems with Percents - 2020 Ontario Curriculum
***************************************************************************


