23 results
Specialty Common Core HSS-ID.C.9 resources
High School Math Common Core Aligned IEP Goal Bank
This IEP goal bank was created to assist special education teachers with the task of writing standards-based IEP goals in math. After spending countless hours developing IEP goals myself and really having to think through how to best individualize goals and objectives for my own students, I wanted to share this resource to help other special education teachers gain back some of their time.This goal bank includes the following:An introduction and guide that explains how to use the document.Each s
Subjects:
Grades:
9th - 12th
CCSS:
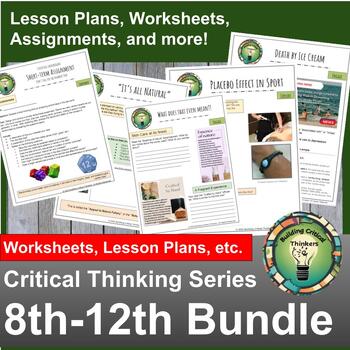
High School Critical Thinking Growing Bundle - Perfect for Depth and Complexity
This is a growing bundle (you'll get additions FOR FREE).Right now, you'll get: Mathematical Misinformation - Using Statistical Shenanigans to Mislead NOW EXPANDEDBut It’s Natural! - Appeal to Nature FallacyWhat does that even mean? Weasel WordsDeath by Ice Cream - Correlation vs CausationQuantum WHAT? The Placebo Effect in ActionAs mentioned, this is a growing bundle, so ensure you sign up to the email list to get notified!
Subjects:
Grades:
8th - 12th, Adult Education
Types:
CCSS:
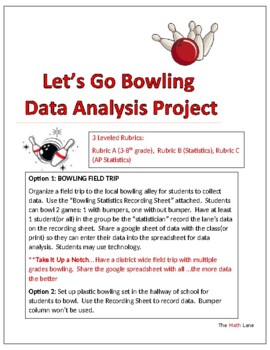
Let's Go Bowling Statistics STEM Project & Field Trip (3-12 and AP Stat)
Great END OF YEAR project. Get ready to strike up some fun with your students on a field trip to the bowling alley or right in your own hallway with a plastic bowling set! This isn't just any ordinary field trip - it's a real-world data collection extravaganza. 3 different leveled rubrics (Grade 4-10, Statistics, AP Statistics) so students can analyze the data based on their math knowledge. Students will be able to practice creating and analyzing graphical displays, scatterplots, construct c
Subjects:
Grades:
Not Grade Specific
Types:
Also included in: High School Statistics Project Bundle
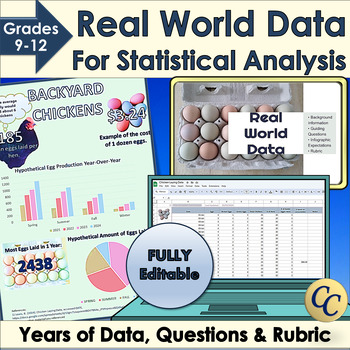
Real World Data for Statistical Analysis and Infographic Project
Give your students access to real world data for your statistical analysis unit or data literacy! Dive into statistics with Microsoft Excel™ or Google Sheets™ and years of data. Learn how to use standard deviation, mean or median to interpret data. Choose the best graphs to display conclusions in an infographic. Works great for science fairs! ✔ Includes an infographic project! (Template, expectations, and rubric). ✔ Everything is fully editable and you and your students can even use the images
Grades:
9th - 12th
Types:
CCSS:
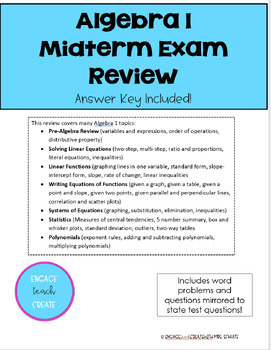
Algebra 1 - Mid-Term Exam Review with Key
This review covers many Algebra 1 topics: · Pre-Algebra Review (variables and expressions, order of operations, distributive property) · Solving Linear Equations (two-step, multi-step, ratio and proportions, literal equations, inequalities) · Linear Functions (graphing lines in one variable, standard form, slope-intercept form, slope, rate of change, linear inequalities· Writing Equations of Functions (given a graph, given a table, given a point and slope, given two points, given parallel and pe
Subjects:
Grades:
8th - 11th
Types:
CCSS:
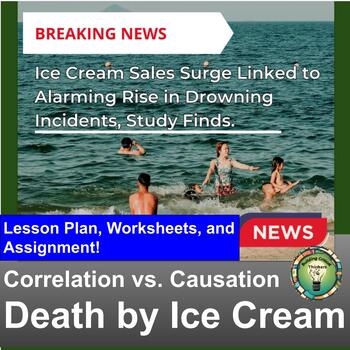
Death by Ice Cream - Correlation vs. Causation - Critical Thinking - 9th-12th
Unlock the potential of your high school students with a dynamic lesson plan designed to hone their critical thinking skills, depth of knowledge, and analytical ability! Introducing "Death by Ice Cream," an engaging lesson meticulously crafted to delve into the nuanced realm of Correlation and Causation, a fundamental principle of critical thinking.This versatile lesson, designed for depth and complexity, is tailored for various instructional settings—whether assigned for individual exploration,
Grades:
8th - 12th
Types:
CCSS:
FREE EDUCATIONAL WEBSITES LIST 4 ALL GRADES K-12 AND SUBJECTS + TEACHER RESOURCE
Sometimes, you just need a list of websites for everyone. Here it is. FREE EDUCATIONAL WEBSITES Put together by Teach Me, Maria!It takes time to gather this information, figure out the appropriate grade levels, and format, maintain, and update this page. All I ask is for an honest review if this list helps you.
Subjects:
Grades:
PreK - 12th, Staff
Types:
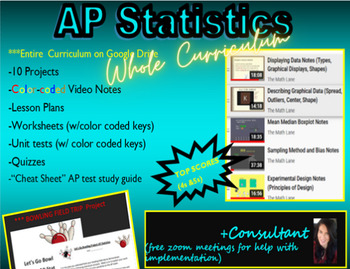
AP Statistics/Stats FULL Curriculum LINK (notes, wksts, PROJECTS) and Consultant
Get ready to supercharge your students' AP Statistics experience with this dynamic curriculum! With over 50% of students earning 4s or 5s on the AP exam, this program is proven to deliver top results. Featuring color-coded video notes, worksheets, activities, and 10 engaging projects, this curriculum is designed to keep students engaged and excited about statistics. Plus, with a Bowling Field Trip Project Opportunity included, students will have the chance to apply their knowledge in a real-worl
Subjects:
Grades:
10th - 12th
CCSS:

Journalism: Market Research Project Slideshow
Prepare your high school journalism students for the exciting world of media with our comprehensive "Market Research Project Slideshow." This 43-slide PowerPoint presentation is thoughtfully designed to guide students through the intricacies of market research, including data analysis, question, and focus generation, all tailored to the context of a high school newspaper.Key Features:Structured Learning: Our slideshow offers a systematic and well-structured approach to teaching market research,
Subjects:
Grades:
7th - 12th
CCSS:
Tongue Twisters
Looking for a fun way for students to gather data? Then, try this tongue twister activity! Students work in a group and time each other saying different length tongue twisters 10 times each. Once they have the data collected, they can use Google Sheets (step-by-step directions provided) to make a scatterplot and insert a trend line. They can then use the line or equation to make a prediction about how long it should take them to say a longer tongue twister 10 times. Finally, they will test
Subjects:
Grades:
5th - 12th
Types:
CCSS:

Name Value Activity
Looking for an easy way to introduce bivariate data, scatterplots and trend lines (line of best fit) to your students? Try this name value activity! Students calculate their name's value and create either one big class scatterplot or individual scatterplots with everyone's data to see if the number of letters in a name impacts name value. To make a class scatterplot, simply draw the graph on large chart paper and have students place a round sticker on their ordered pair, or share a Google She
Subjects:
Grades:
6th - 12th
CCSS:
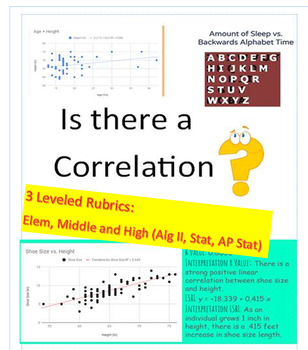
Correlation? Data Project (3 Rubrics_Elem/Middle School/ AP Stats) EOY
Get ready to supercharge your students' data analysis skills with this dynamic project! Perfect for end of year or semester project. In this engaging activity, students will have the exciting opportunity to collect their own data through surveys, online research, or real world data sets. They will then dive deep into the world of statistics as they determine if there is a correlation between two variables. With three different leveled rubrics, this project is perfect for students of all ages an
Subjects:
Grades:
Not Grade Specific
Types:
CCSS:
Also included in: High School Math Projects (Algebra II and Statistics) STEM No prep
Common Core Algebra I - Unit #10.Statistics
Standard statistical displays of data are reviewed at the beginning of the 10 lesson unit. Box plots are used to compare data sets and emphasize use of the quartiles and interquartile range. Measures of central tendency and dispersion, such as mean and standard deviation, are discussed and interpreted in real world scenarios. Two way frequency charts are used to compare data and bivariate data analyses allow the fitting of data with linear and exponential functions.To access the lesson videos on
Subjects:
Grades:
8th - 10th
CCSS:
High School Interpreting Categorical and Quantitative Data IEP math goals
Do you feel frustrated and overwhelmed with everything on your plate? No need to sweat the small stuff. Relieve your current and future headaches with these premade IEP goals. There is no mixing and matching needed. This premade Interpreting Categorical and Quantitative Data IEP math goals packet is designed to save you valuable time, frustration, and headaches. Simply fill in the bold information to personalize each goal. This is a high school Interpreting Categorical and Quantitative Data IEP
Grades:
9th - 12th
Types:
CCSS:
Also included in: Algebra 1 IEP Math Goals
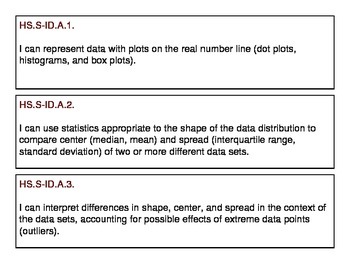
High School Probability and Statistics Concept "I Can" Statement Strips
This file contains all of the CCSS for the "Probability and Statistics" conceptual category in grades 9-12. This PDF can be printed and cut out to post for daily lessons. They will fit a pocket chart or you can add magnets to the back and display them on a magnetic whiteboard. Tabulated sections will keep your strips organized. They will fit perfectly in a file folder system or even a shoebox.
Subjects:
Grades:
7th - 12th
CCSS:

Financial Algebra Chapter 1 Study Guide
This is a study guide based on lessons 1-1, 1-2, and 1-5 of the text book Financial Algebra by Gerver and Sgroi. The topics covered are discretionary expenses with statistics applications.
Grades:
9th - 12th
Types:
CCSS:
Ohio Learning Standards (OLS) for Stats + 'I Can' Statements
Are you required to use the content standards on your lesson plans? And the 'I Can' statements? This product lists the 8 Mathematical Practices, an overview of the Statistics Learning Standards, and then the standards, each one accompanied by an 'I can' statement. The OLS are almost exactly the same as the Common Core State Standards, but for a little bit of the language and the notation. Oh, and this is FREE!
Grades:
10th - 12th
CCSS:
SPSS software Secondary Data Analysis Workshop (Introductory/AP Statistics)
This handout is intended for those interested in teaching/learning basic introductory statistics concepts to analyze real data. Students will learn how to tell a story using secondary data analysis. The handout is for SPSS and the US Longitudinal Study of Adolescent Health data set. For handouts on the data set code book and raw data file, a PowerPoint to accompany the handout, or questions please email kristin.flaming@gmail.com or ldierker@wesleyan.edu.This handout was developed as a condensed
Subjects:
Grades:
6th - 12th, Higher Education, Adult Education
Types:
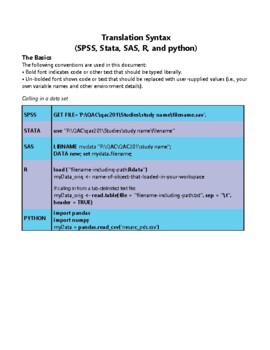
Translation Code
As part of our NSF-funded passion-driven statistics project, we have just started to share more widely our “translation code” aimed at supporting folks in learning code-based software and in moving more easily between them. The pdf includes all of the basic syntax for managing, displaying and analyzing data, translated across SAS, R, Python, Stata and SPSS. http://bit.ly/PDSTranslationCode.For more information about our warm and welcoming data-driven curriculum, check out https://passiondrivenst
Grades:
6th - 12th, Higher Education, Adult Education
Types:
STATA software Secondary Data Analysis
This handout is intended for those interested in teaching/learning basic introductory statistics concepts to analyze real data. Students will learn how to tell a story using secondary data analysis. The handout is for STATA software and the US Longitudinal Study of Adolescent Health data set. For handouts on setting up an account, the data set code book and raw data file, a PowerPoint to accompany the handout, or questions please email kristin.flaming@gmail.com or ldierker@wesleyan.edu.This
Grades:
6th - 12th, Higher Education, Adult Education
Types:
SAS software Secondary Data Analysis Workshop (Introductory/AP Statistics)
This handout is intended for those interested in teaching/learning basic introductory statistics concepts to analyze real data. Students will learn how to tell a story using secondary data analysis. The handout is for SAS (email for R, SPSS, Stata, & Python), a free cloud based system and the US Longitudinal Study of Adolescent Health data set. For handouts on setting up a free SAS account, the data set code book and raw data file, a PowerPoint to accompany the handout, or questions please e
Grades:
6th - 12th, Higher Education, Adult Education
Types:
R software Secondary Data Analysis Workshop (Introductory/AP Statistics)
This handout is intended for those interested in teaching/learning basic introductory statistics concepts to analyze real data. Students will learn how to tell a story using secondary data analysis. The handout is for R or R Studio, a free cloud based system and the US Longitudinal Study of Adolescent Health data set. For handouts on setting up a free R account, the data set code book and raw data file, a PowerPoint to accompany the handout, or questions please email kristin.flaming@gmail.com or
Subjects:
Grades:
6th - 12th, Higher Education, Adult Education
Types:
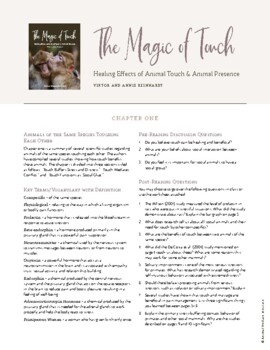
Magic of Touch Lesson Plans - English
Magic of Touch is a compilation of many different scientific studies that establish how positive physical contact has benefits for animals and humans alike. High school teachers and college professors will find this text and accompanying lesson plans appropriate for students in environmental studies, philosophy classes, or any specialty class that explores animal behavior.
Subjects:
Grades:
11th - 12th, Higher Education
Types:
CCSS:
Showing 1-23 of 23 results

