26 results
Applied math Common Core HSS-ID.C.9 resources
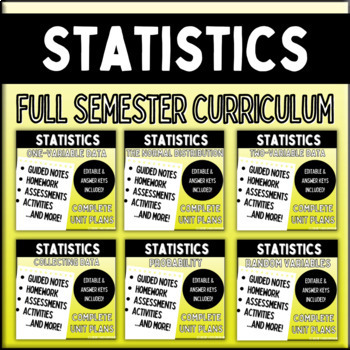
Statistics: FULL CURRICULUM BUNDLE
Statistics: Full Curriculum This is the FULL CURRICULUM bundle for my regular-level, Statistics course. If you are looking for my full curriculum for AP Statistics, follow the link here. This full curriculum is six units long and lasts 1 semester, approximately 90 school days. The following units are included in this bundle: Unit 1 – One-Variable DataUnit 2 – The Normal DistributionUnit 3 – Two-Variable DataUnit 4 – Collecting DataUnit 5 – ProbabilityUnit 6 – Random Variables Each unit contains
Subjects:
Grades:
11th - 12th
Types:
CCSS:
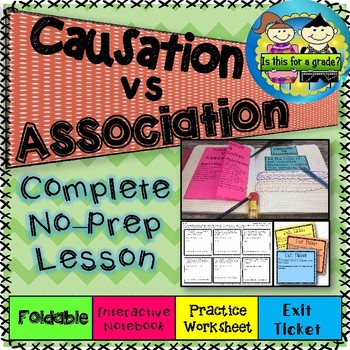
Causation vs Association (Correlation) Foldable, Activity, Practice, & Exit
Complete lesson, start to finish at your finger tips. The lesson introduces differentiating between causation vs association. The foldable is a great guided practice, the interactive notebook is a great way for students to collaborate and create and manipulate, the practice sheet can be used to reinforce, and I find exit tickets KEY to the assessment process. It allows me to see who has it and common misconceptions that I need to fix. What's Included:Foldable NotesInteractive Notebook ActivityPr
Subjects:
Grades:
8th - 12th
CCSS:
Also included in: Linear Functions Mega Bundle: No Prep Foldable Lessons
Statistics: Two Variable Data
StatisticsUnit 3: Two-Variable Data Complete Unit Bundle that teaches scatterplots, correlation, linear regression, and more! Welcome! These are the complete unit plans for the third unit in my regular level Statistics class. If you are interested in the AP Statistics unit plans, check out my listing here. Included in this resource: 5 complete sets of student guided notes (annotated answer keys included)5 homework problem sets + complete test review (annotated answer keys included)2 assessments
Subjects:
Grades:
10th - 12th
Types:
CCSS:
Also included in: Statistics: FULL CURRICULUM BUNDLE
Measures of Center & Variance Unit Bundle - Distance Learning Compatible
This is a selection of my Measures of Center & Variance resources all in a money saving Essential Bundle! You save significant money and time versus purchasing these separately!Essential Bundles are designed to give you everything you need to rock your unit. Warmups, Notes, Activities, Games, Exit Tickets, and Tests. You will find a selection of my Drive Instruction, Escapes, Boot Camp, Adventures, Whodunnits, CSI, Person Puzzles, STEM-ersions, Herowork, TableTop and my 21st Century Math Pro
Subjects:
Grades:
6th - 12th
Types:
AP Statistics Curriculum Review / Daily Warmups
Introducing the Ultimate AP Statistics Resource!Unlock the potential of your AP Statistics students with a meticulously crafted resource, designed to engage and challenge them while aligning perfectly with the AP Statistics curriculum. Created by a seasoned teacher who achieved a remarkable 80% success rate in guiding students to earn 5's on the AP Statistics exam, this resource is a game-changer for any AP Statistics classroom.What sets this resource apart? It's the infusion of current culture
Subjects:
Grades:
9th - 12th
Types:
CCSS:
AP Stat Unit 1,2,3 Describing Data, Linear Regression, Experiments/Sampling
This bundle includes complete guided notes, homework, and editable quizzes for the first 3 units of AP Statistics. The bundle also includes three FBI Most Wanted activities to use with the units and an activity to use with students during the first few weeks of school.
Subjects:
Grades:
9th - 12th
Types:
CCSS:
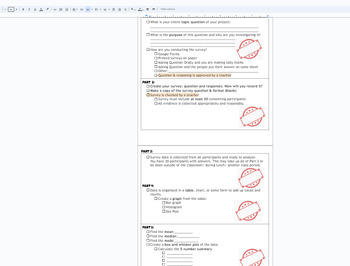
Statistics Survey project Discovery (broken down into sections) with Rubric
This is a broken down (scaffolded) packet of instructions/ guide for a Stats Project for Math 1 HS or 8th grade students. The goal of the project is for students to take a statistical survey on quantitative data (numbers) of their choice. Using this data from the survey, the following will be included in the project:Survey- the question being askedSurvey responses (requirement of 30)Data organization: Bar chart, Histogram, Dot PlotMeanMedianModeBox and Whisket Plot5 number summary (Q1,Q2,Q3, min
Subjects:
Grades:
7th - 12th, Higher Education, Adult Education
CCSS:
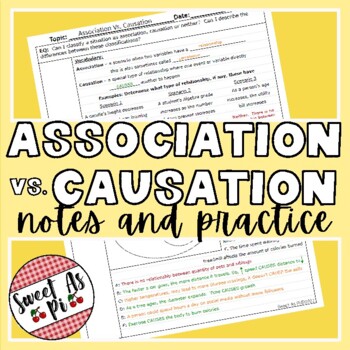
Association Vs. Causation - Guided Notes and Practice
This step by step, discussion driven, no-prep notes and practice set that covers Association and Causation is a great way to teach & introduce classifying these situations like the new STAAR items types to your students. The first part of the notes goes over the definitions with 3 examples to discuss together. The second part can be used as independent practice or as guided practice, where students work independently, with a partner or within a small group. This set’s practice has a diagram
Subjects:
Grades:
7th - 10th
CCSS:
Data and Statistics (DS) Bundle
Shape, center and spread, the normal distribution, sampling and linear regression are all explored in this introduction to statistics. These missions are aligned with Common Core Standards from the Statistics and Probability category for 8th grade and high school.
The fun stuff:
Heart rates and marathons, coins and NBA heights, this bundle gives students the chance to explore shape, center, and spread with coins, dice, heights, shoe sizes and more. They also explore linear regression and even
Subjects:
Grades:
7th - 12th
CCSS:
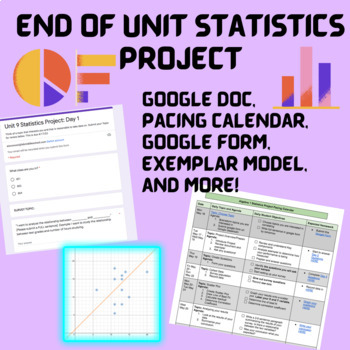
End of Unit Statistics Project- Collecting and Analyzing Data!
This is an amazing hands off project for your students to work on during their statistics unit. I often replace our end of unit test with this project, and make it a take-home assessment so they are doing most of the work for homework, but you could easily build it into your class periods! Students will be required to: come up with a survey topic determine population, sample, and questionsgather the data and turn it into a scatterplotdetermining the line of best fitresidualscorrelation coefficie
Subjects:
Grades:
6th - 12th
Types:
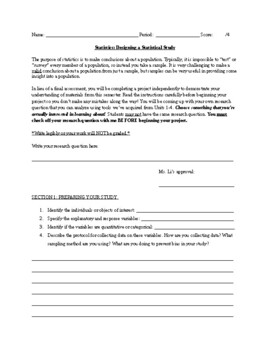
Statistics Project: Regressions + Designing a Statistical Study for High School
Hello!I've designed a statistics project that students in my class loved! This project requires students to go collect data on a topic that interests them. They have to design a sampling method that is as unbiased as possible. Students are then required to analyze their data and summary statistics. They also need to do a regression analysis on their study and make inferences using their results. This is perfect for a replacement of a test or as an end-of-semester project for students. Perfect fo
Subjects:
Grades:
9th - 12th, Higher Education
Types:
CCSS:
Also included in: AP Statistics / High School Statistics Projects
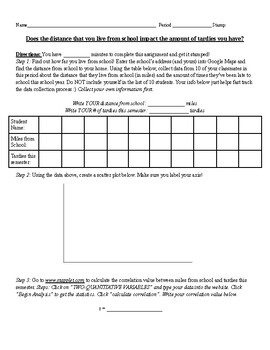
Correlation and Least Squares Regression Line Activity: High School Statistics
Hi! This activity will take 40 minutes to 1 hour to complete. It requires students to collect data from their classmates and use the data to do a regression analysis. The activity provides a statistical analysis website plus instructions for students to do regression analysis calculations. The materials students will need include a computer. Optional materials include a calculator. This activity can be provided on Google Classroom or printed as a physical copy for students to write on (preferred
Subjects:
Grades:
9th - 12th
Types:
CCSS:
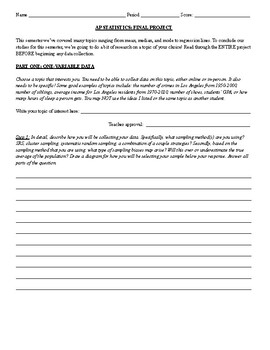
AP Statistics Project: Normal Distributions, Regression Analysis, and Sampling
If you are looking for a cumulative project that summarizes the three topics relating to: one-variable data analysis, two-variable data analysis, and sampling methods, this is a great project to provide to your regular or AP Statistics students. Topics covered in this project include normal distributions, scatterplots, correlation, regression analysis, sampling methods, sampling biases, and statistical thinking. It covers Unit 1, Unit 2, and Unit 3 materials in the AP Statistics suggested course
Subjects:
Grades:
11th - 12th
Types:
CCSS:
Also included in: AP Statistics / High School Statistics Projects
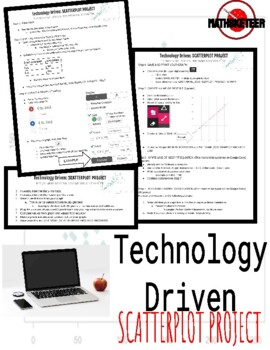
Technology Driven: Scatter Plot Project
This is a TECHNOLOGY DRIVEN project worth 100 points.The following (free) technologies are required:-Google Docs-Kami (Annotating Software)-Desmos (Graphing Software)All Software is available through any Internet Browser.The project features detailed step by step student instructions and examples (with pictures for those not familiar with the software).Project Breakdown:-Research on correlated items (i.e. fat content and calories)-Table Creation-Graphing Points-Line of Best Fit-Conceptual Unders
Subjects:
Grades:
8th - 11th
Types:
CCSS:
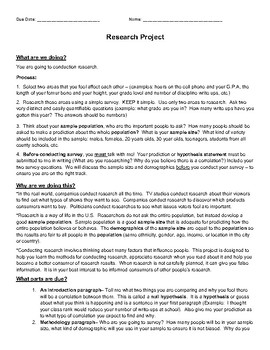
Statistical Research Project and Paper - Let Students Choose the Topic
We know that reading and writing are important skills for any discipline or career. Bring some real-world research experience to your advanced 8th grade classroom or high school math class by teaching them how to apply statistics. Students will have choice in determining the topic of their research project and students may work individually or in small groups to complete the assignment. Through real world application of statistics students will gain valuable experience with writing and readin
Subjects:
Grades:
8th - 11th
Types:
CCSS:
Linear Regression (DS5): HSS.ID.B.6, HSS.ID.C.7, HSS.ID.C.8...
Students will visualize the relationship between two variables, look for correlation and speculate as to causality. They will explore the trend line as a set of statistics which summarize the data and allow for estimation of additional data points. They will use the calculator to find the line of best fit and the correlation coefficient and interpret these in the context of the real world data. This mission is aligned with Common Core State Standards: HSS.ID.B.6, HSS.ID.C.7, HSS.ID.C.8, HSS.ID.C
Subjects:
Grades:
7th - 12th
CCSS:
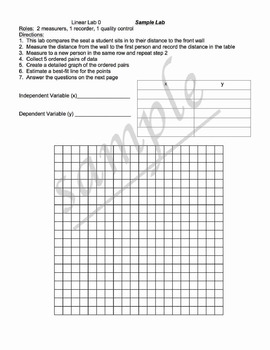
Linear Relationship Labs
This project has 1 sample lab to complete together as a class and 6 other labs that create a linear relationship.
Students work through the labs collecting data and then analyze the data to create equations, use calculators or spreadsheets to create regression equations (best fit lines), and use the equations to make predictions.
classes: algebra 1, geometry, algebra 2, applied math
Here are links to my other algebra projects:
Click Here to see my project: Systems of Equations - Comparing Ph
Subjects:
Grades:
7th - 12th, Higher Education, Adult Education
Types:
CCSS:
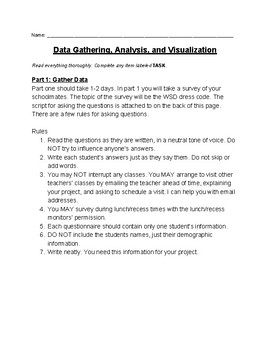
Dress Code Data Analysis and Visualization
If your school has a dress code, use this Project Based Learning packet to teach your students about gathering, analyzing, and visualizing authentic data. The packet covers calculating percentages, measures of central tendency (mean, median, mode) and range, analyzing multiple data sets in conjunction to determine correlations, and visualizing data for improved analysis and communication. The packet is written to be mostly self guided. It is great as an enrichment project or as a whole class pro
Subjects:
Grades:
5th - 9th
Types:
CCSS:
Slope Linear Regression (Test and Confidence Intervals) Marker Board Practice
Get ready to supercharge your statistics lesson with this dynamic activity designed to help your students practice finding slope, linear regression, hypothesis tests, and confidence intervals! With 12 engaging questions and answers conveniently displayed on a PowerPoint presentation, you can easily post them on the board for a visually stimulating classroom experience. Perfect for Statistics and AP Statistics courses, this activity will not only challenge your students but also enhance their und
Subjects:
Grades:
10th - 12th
Types:
CCSS:
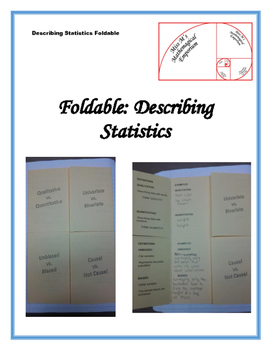
Describing Statistics Foldable
**Please read the instructions included to be able to print this product correctly!**
My students love foldables! They make great study tools. Included in this foldable are different ways of describing statistics, definitions, and examples. The different descriptors are univariate vs bivariate, qualitative vs. quantitative, causal vs. not causal, and unbiased vs. biased.
If you have any requests for foldables, please let me know. I'd be happy to create one to meet your needs!
Check out my ot
Subjects:
Grades:
9th - 12th
CCSS:
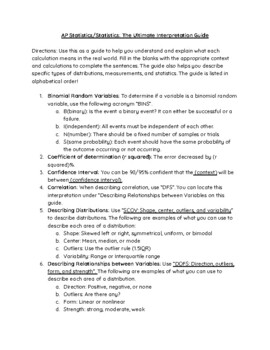
AP Statistics: Interpretations Guide: What does each statistic mean?
Hi teachers! This resource is great for your elementary, regular, or AP Statistics course. Students can use this guide all year long. We want our students to actually understand what they are calculating and connect their learning to real-world contexts! This resource will help them do just that. Some interpretations covered are mean, median, mode, and more. Here are the directions for use of the interpretations guide: Directions: Use this as a guide to help you understand and explain what each
Subjects:
Grades:
7th - 12th
CCSS:
Passion-Driven Statistics E-book (Introductory/AP Statistics Course Textbook)
Passion-Driven Statistics is an NSF-funded, multidisciplinary, project-based curriculum that supports students in conducting data-driven research, asking original questions, and communicating methods and results using the language of statistics. The curriculum supports students to work with existing data covering psychology, health, earth science, government, business, education, biology, ecology and more. From existing data, students are able to pose questions of personal interest and then use
Subjects:
Grades:
6th - 12th, Higher Education, Adult Education
Types:
Math Exit Slip for Grades 7-10
Just want to share this gorgeous ONLINE math exit slip that's built like a Kahoot! It's super easy to use and comes with auto-generated math questions for Grades 7-10 that are based off Singapore maths curriculum... My students love it :-) Best part is you don't even need to create an account to use it. Absolutely free.https://mentor.joni.ai/slipI have also included a PDF that introduces some of the other features if you sign-up for a Mentor account.
Subjects:
Grades:
7th - 10th
Types:
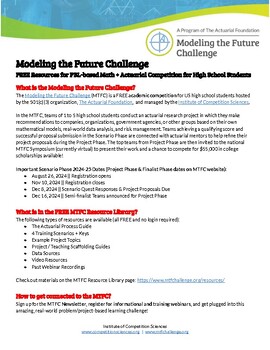
Flooding Losses Math Modeling Training Scenario (Instructor Version+Answers)
This is a training scenario that was created for the Modeling the Future Challenge (MTFC), a FREE problem/project-based learning competition for high school students. The DATA SET can be found here.This is one of many free resources that are available through the MTFC and is a fantastic opportunity for high school students to apply math concepts, have an authentic audience and mentors, and engage in interdisciplinary problem-solving work while competing for college scholarships. We invite you yo
Subjects:
Grades:
9th - 12th
CCSS:
Showing 1-24 of 26 results


