8 results
Graphing Common Core HSS-ID.C.9 resources
Algebra 1 Curriculum
Get a complete High School Algebra 1 curriculum including units on solving equations and inequalities, linear functions, exponents and exponential functions, factoring polynomials, quadratics, and more! These ready-to-use Algebra 1 resources include everything you need to teach high school algebra to your on-level or lower-level/special education class. Supplements would be needed for an honors class.Each unit contains guided notes, practice worksheets for the classroom and/or homework, activiti
Grades:
8th - 11th
CCSS:
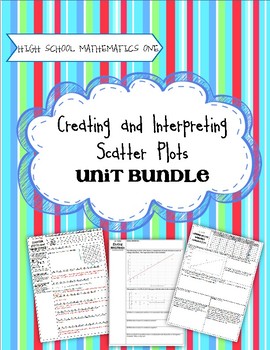
High School Math 1: Scatter Plots and Correlation
Task-Based Learning gets students intrinsically motivated to learn math! No longer do you need to do a song and dance to get kids interested and excited about learning. The tasks included in this unit, followed by solidifying notes and practice activities, will guarantee that students understand the concepts. This unit will effectively teach how to create and interpret scatter plots, calculate a linear model for best fit, calculate a correlation coefficient, and how to use a residual to deter
Subjects:
Grades:
8th - 10th
Types:
CCSS:
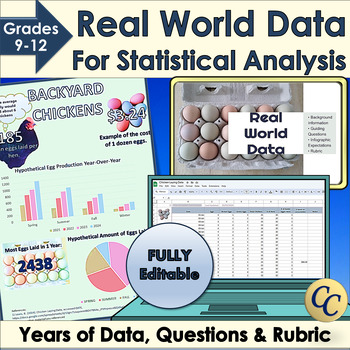
Real World Data for Statistical Analysis and Infographic Project
Give your students access to real world data for your statistical analysis unit or data literacy! Dive into statistics with Microsoft Excel™ or Google Sheets™ and years of data. Learn how to use standard deviation, mean or median to interpret data. Choose the best graphs to display conclusions in an infographic. Works great for science fairs! ✔ Includes an infographic project! (Template, expectations, and rubric). ✔ Everything is fully editable and you and your students can even use the images
Grades:
9th - 12th
Types:
CCSS:
9th Grade Saxon Secondary 1 Math Powerpoints
These 120 Powerpoint lessons work hand in hand with the Saxon Algebra 1 math textbook. If you do not teach the Saxon program then these Powerpoints can be used to help teach the Secondary 1 Common Core. Each Powerpoint consists of a lesson overview which includes formulas and direct instructions. After that there are several practice problems that allows students to put into practice what they just learned. This is a great opportunity for group work as well as for the teacher to walk around the
Grades:
8th - 9th
Types:
CCSS:
Correlation Coefficient - Printable & Digital Activity - Chico Mendes Puzzle
Bring to life the traditional practice class or homework assignment with some global competency and diversity! While your students practice with correlation coefficients, they can learn about the courageous worker right's advocate, Chico Mendes!Person Puzzles are designed to highlight individuals with diverse backgrounds who have made significant contributions to our world. I typically use Person Puzzles as timed warm-ups which allows me to share a little about the person's background before my
Subjects:
Grades:
8th - 12th
Types:
CCSS:

Correlation of Scatterplots - Printable & Digital Activity Angela Merkel Puzzle
Bring to life the traditional practice class or homework assignment with some global competency and diversity! While your students practice with scatterplots, they can learn about the courageous world leader, Angela Merkel!Person Puzzles are designed to highlight individuals with diverse backgrounds who have made significant contributions to our world. I typically use Person Puzzles as timed warm-ups which allows me to share a little about the person's background before my daily lesson. I can al
Subjects:
Grades:
8th - 12th
Types:
CCSS:
Algebra 1 Weekly Assessments for Units 1-3
Are you ready to try weekly assessments with your students, but not sure where to begin? Sometimes the hardest part of change is taking the first step.
Get your first 9 weeks of Weekly Assessments with the following skills:
-Two Step Equations
-Order of Operations
-Create a Table, Graph and Equation from a Situation
-Identify a Function
-Evaluate a Function
-Basic Systems with a table and graph
-Identify Linear, Exponential, Quadratic, and Absolute Value Functions
-Slope
-Inverse Functions
-Tr
Subjects:
Grades:
7th - 10th
Types:
CCSS:
Linear Regression (DS5): HSS.ID.B.6, HSS.ID.C.7, HSS.ID.C.8...
Students will visualize the relationship between two variables, look for correlation and speculate as to causality. They will explore the trend line as a set of statistics which summarize the data and allow for estimation of additional data points. They will use the calculator to find the line of best fit and the correlation coefficient and interpret these in the context of the real world data. This mission is aligned with Common Core State Standards: HSS.ID.B.6, HSS.ID.C.7, HSS.ID.C.8, HSS.ID.C
Subjects:
Grades:
7th - 12th
CCSS:
Showing 1-8 of 8 results


