17 results
Not grade specific statistics resources on sale
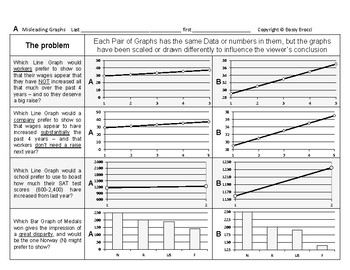
Stats&Data 14: Misleading & Misinterpreting Data Graphs Charts Statistics
This is an excerpt from my popular line ofBossy Brocci Math & Big Science workbooks on Amazon.ANSWER KEY included=======================Students will:1) Analyze 20 different Graphs or Data Displays2) Draw Conclusions & Answer questions about theaccuracy, fairness, limitations & legitimacy of those Graphs3) Answer 16 Multiple-choice questionsbased on their Calculations & Observations4) Be compelled to show their work in a neat & orderly format5) Be trained to methodically &
Subjects:
Grades:
Not Grade Specific
Types:
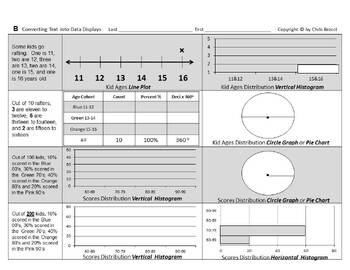
Stats&Data Bundle C: Data Displays Measures of Central Tendency & Variation
From the Author of Bossy BrocciMath & Big Science workbooks on Amazon,this Bundle of Data Displays,Measures of Central Tendency(Mean, Median, Mode & Range);and Measures of Variation(Quartiles, Interquartile Range, Outliers & Box Whisker plots)contains:11 Lessons32 Worksheets832 Problems & Tasks- and Assessment up the a$$=======================Answer KEYS included=======================Coverage Specifics:#1 Identify & Select Common Typesof Data DisplaysStudents will:1) Identi
Subjects:
Grades:
Not Grade Specific
Types:
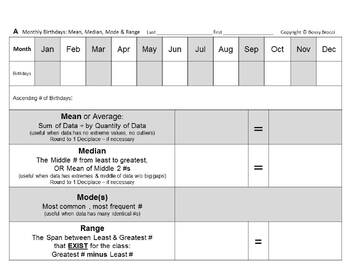
Stats&Data Bundle B: Birthdays Data Displays Variation Mean Median Mode Range
From the Author of Bossy BrocciMath & Big Science workbooks on Amazon,this Birthdays Stats (Mean, Median, Mode, Range),Measures of Variation & Data Displays Bundlecontains:2 Lessons12 Worksheets294 Problems & Tasks- and Assessment up the a$$=======================Answer KEY included=======================Coverage Specifics:#1 Author's Numbers Birthdays ProjectStudents will:1) Convert the given Monthly Birthdaysfrom Mr. Brocci's School numbers into:Ascending List/Data SetMeanMedianMod
Subjects:
Grades:
Not Grade Specific
Types:
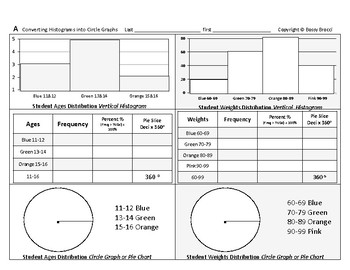
Stats&Data 03: Convert Histograms into Circle Graphs Construct Create Pie Charts
This is an excerpt from my popular line ofBossy Brocci Math & Big Science workbooks on Amazon.Answer KEY included=======================Students will:1) Convert 3 Vertical Histograms into3 Data Tablesand3 Colored or Shaded Circle Graphs (Pie Charts)2) Convert 1 Horizontal Histogram into1 Data Tableand1 Colored or Shaded Circle Graph (Pie Chart)3) Be compelled to show their work in a neat & orderly format4) Be trained to methodically & systematicallyPresent Data in different DisplaysN
Subjects:
Grades:
Not Grade Specific
Types:
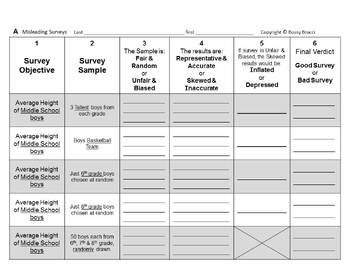
Stats&Data Slides Bundle D: Misleading Misinterpreting Surveys Statistics Graphs
From the Author of Bossy BrocciMath & Big Science workbooks on Amazon,comes student fillable editable interactiveGoogle Slides™ for Google Classroom™ Students can insert/overlay text & graphics[textboxes, shapes, lines, arrows, colors etc.]onto the G-Slide image backgroundorConvert to PDF, then make it interactive onlineby using various third-party Ed. websitesorPrint it for paper worksheets=======================This Bundle onMisleading & MisinterpretingSurveys, Statistics, and Gr
Subjects:
Grades:
Not Grade Specific
Types:
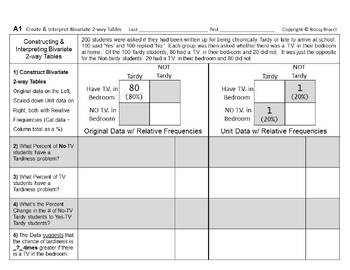
Stats&Data Slides 12: Construct Analyze Bivariate Two-way Frequency Data Tables
From the Author of Bossy BrocciMath & Big Science workbooks on Amazon,comes student fillable editable interactiveGoogle Slides™ for Google Classroom™ Students can insert/overlay text & graphics[textboxes, shapes, lines, arrows, colors etc.]onto the G-Slide image backgroundorConvert to PDF, then make it interactive onlineby using various third-party Ed. websitesorPrint it for paper worksheetsANSWER KEY included=======================Students will:1) Construct a Pair of Raw and Unit/Simpl
Subjects:
Grades:
Not Grade Specific
Types:
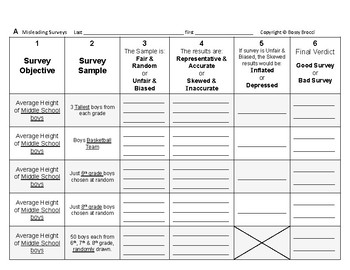
Stats&Data 13: Misleading & Misinterpreting Surveys & Statistics + QUIZ
This is an excerpt from my popular line ofBossy Brocci Math & Big Science workbooks on Amazon.ANSWER KEY included=======================Students will:1) Read 10 different Surveys and Survey Samples2) Determine and Write if those Surveys are:Fair & RandomUnfair & BiasedRepresentative & AccurateSkewed & InaccurateInflatedDepressedGood SurveyBad Survey3) Answer 24 Multiple-choice questionsbased on their Observations4) Analyze 5 Statistical Problems & Conclusions for accuracy
Subjects:
Grades:
Not Grade Specific
Types:
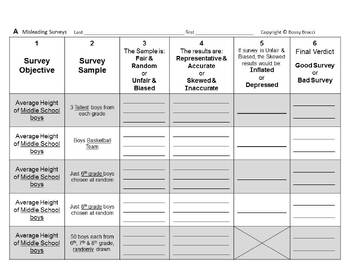
Stats&Data Slides 13: Misleading & Misinterpreting Surveys & Statistics + QUIZ
From the Author of Bossy BrocciMath & Big Science workbooks on Amazon,comes student fillable editable interactiveGoogle Slides™ for Google Classroom™ Students can insert/overlay text & graphics[textboxes, shapes, lines, arrows, colors etc.]onto the G-Slide image backgroundorConvert to PDF, then make it interactive onlineby using various third-party Ed. websitesorPrint it for paper worksheetsANSWER KEY included=======================Students will:1) Read 10 different Surveys and Survey S
Subjects:
Grades:
Not Grade Specific
Types:
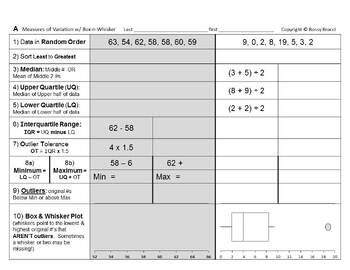
Stats&Data Slides 06: Quartiles Interquartile Range Outliers Box Whisker Plots
From the Author of Bossy BrocciMath & Big Science workbooks on Amazon,comes student fillable editable interactiveGoogle Slides™ for Google Classroom™ Students can insert/overlay text & graphics[textboxes, shapes, lines, arrows, colors etc.]onto the G-Slide image backgroundorConvert to PDF, then make it interactive onlineby using various third-party Ed. websitesorPrint it for paper worksheetsAnswer KEY included=======================Students will:1) Sort or Sequence 8 different Data Sets
Subjects:
Grades:
Not Grade Specific
Types:
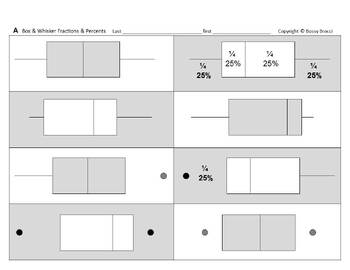
Stats&Data Slides 08: Convert Label Box and Whisker Plots to Fractions Percents
From the Author of Bossy BrocciMath & Big Science workbooks on Amazon,comes student fillable editable interactiveGoogle Slides™ for Google Classroom™ Students can insert/overlay text & graphics[textboxes, shapes, lines, arrows, colors etc.]onto the G-Slide image backgroundorConvert to PDF, then make it interactive onlineby using various third-party Ed. websitesorPrint it for paper worksheetsAnswer KEY included=======================Students will:1) Analyze 16 Box & Whisker Plots (Bo
Subjects:
Grades:
Not Grade Specific
Types:
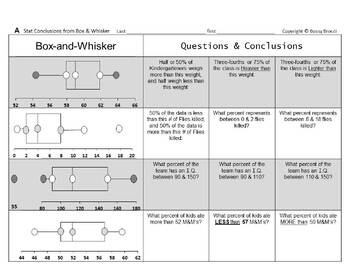
Stats&Data Slides 09: Statistical Conclusions from Box and Whisker Plots QUIZ
From the Author of Bossy BrocciMath & Big Science workbooks on Amazon,comes student fillable editable interactiveGoogle Slides™ for Google Classroom™ Students can insert/overlay text & graphics[textboxes, shapes, lines, arrows, colors etc.]onto the G-Slide image backgroundorConvert to PDF, then make it interactive onlineby using various third-party Ed. websitesorPrint it for paper worksheetsAnswer KEY included=======================Students will:1) Analyze 8 Box & Whisker Plots (Box
Subjects:
Grades:
Not Grade Specific
Types:
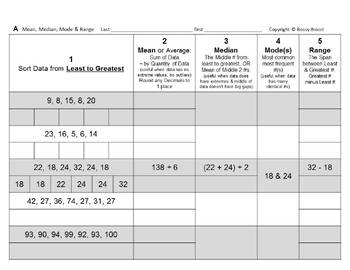
Stats&Data Slides 05: Calculate Measures Central Tendency Mean Median Mode Range
From the Author of Bossy BrocciMath & Big Science workbooks on Amazon,comes student fillable editable interactiveGoogle Slides™ for Google Classroom™ Students can insert/overlay text & graphics[textboxes, shapes, lines, arrows, colors etc.]onto the G-Slide image backgroundorConvert to PDF, then make it interactive onlineby using various third-party Ed. websitesorPrint it for paper worksheetsAnswer KEY included=======================Students will:1) Calculate Mean, Median, Mode and Range
Subjects:
Grades:
Not Grade Specific
Types:
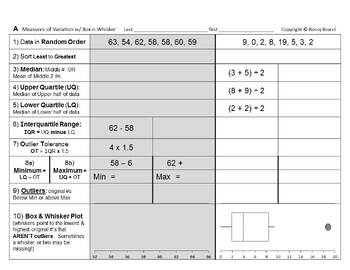
Stats&Data Bundle A: Box Whisker Box Plots & Measures of Variation bundle
Spun-off from my popular series of Bossy Brocci Math & Big Science Workbooks on Amazon,this Measures of Variation Box & WhiskerBox Plots Bundlecontains:4 Lessons10 Worksheets263 Problems & Tasks- and Assessment up the a$$=======================Answer KEYS included=======================Coverage Specifics:#1 From Quartiles Interquartile Range& Outliers to Box Whisker PlotsStudents will:1) Sort or Sequence 8 different Data Sets or Sets of Numbers2) Calculate & Identify for each
Subjects:
Grades:
Not Grade Specific
Types:
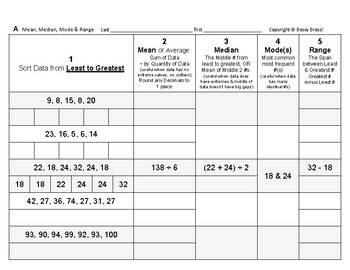
Stats&Data 05: Calculate Measures of Central Tendency Mean Median Mode & Range
This is an excerpt from my popular line ofBossy Brocci Math & Big Science workbooks on Amazon.Answer KEY included=======================Students will:1) Calculate Mean, Median, Mode and Rangefrom 10 different sets of Data or Numbers2) Be compelled to show their work in a neat & orderly format3) Be trained to methodically & systematically CalculateMeasures of Central Tendency Note: If you're looking for Box & Whisker Plots, then see my Stats&Data Lessons 06, 07, 08 and 09=====
Subjects:
Grades:
Not Grade Specific
Types:
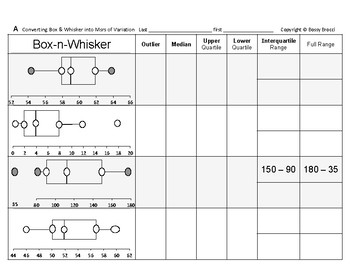
Stats&Data 07: Convert Box Whisker Plots Quartiles Interquartile Range Outliers
This is an excerpt from my popular line ofBossy Brocci Math & Big Science workbooks on Amazon.Answer KEY included=======================Students will:1) Analyze 8 Box & Whisker Plots (Box Plots)2) Identify:OutlierMedianUpper QuartileLower QuartileInterquartile RangeandFull Rangefrom each Box & Whisker Plot3) Be compelled to show their work in a neat & orderly format4) Be trained to methodically & systematically Analyzeand Convert Box & Whisker Plots into Measures of Varia
Subjects:
Grades:
Not Grade Specific
Types:
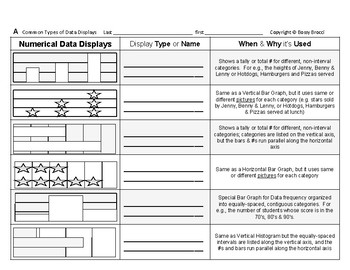
Stats&Data 01: Identify & Select Common Types of Data Displays
This is an excerpt from my popular line ofBossy Brocci Math & Big Science workbooks on Amazon.Answer KEY included=======================Students will:1) Identify and Label various Data Displays, including: Vertical Bar GraphVertical PictographHorizontal Bar GraphHorizontal PictographVertical HistogramHorizontal HistogramLine Plot (X Plot)Stem and Leaf PlotCircle Graph or Pie ChartandLine Graph2) Read about and Learn the appropriate usagefor each of those Data Displays3) Be compelled to show
Subjects:
Grades:
Not Grade Specific
Types:
Stats&Data 10: Author Birthdays Variation Central Tendency Data Displays Project
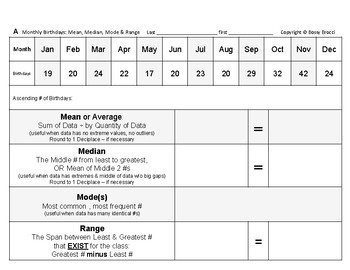
This is an excerpt from my popular line ofBossy Brocci Math & Big Science workbooks on Amazon.Answer KEY included=======================Students will:1) Convert the given Monthly Birthdays from Mr. Brocci's School into:Ascending List/Data SetMeanMedianModeRangeUpper QuartileLower QuartileInterquartile RangeOutlier ToleranceAllowed MinimumAllowed MaximumOutliersBox & Whisker PlotVertical Bar GraphLine GraphStem & Leaf PlotLine Plot (X Plot)Data TableCircle Graph (Pie Chart)andVertical
Subjects:
Grades:
Not Grade Specific
Types:
Showing 1-17 of 17 results


