45 results
Not grade specific statistics resources $10 and up
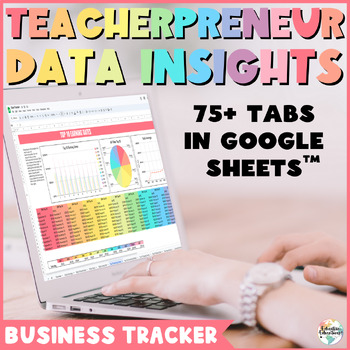
Teacherpreneur Data Insights - TPT Seller Business Tracker Analysis Spreadsheets
Welcome to Teacherpreneur Data Insights – a business data tracker designed to elevate your teacher seller journey. Gain actionable insights, track trends, and optimize your strategies with this comprehensive tool. In a world where data is powerful, this guidebook and Google Sheets combo empowers you to navigate your TPT store effectively. Seamlessly analyze your metrics, make informed decisions, and propel your store to new heights. Utilize this powerful tool to identify your best-selling produc
Subjects:
Grades:
Not Grade Specific
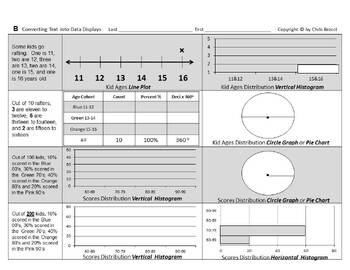
Stats&Data Bundle C: Data Displays Measures of Central Tendency & Variation
From the Author of Bossy BrocciMath & Big Science workbooks on Amazon,this Bundle of Data Displays,Measures of Central Tendency(Mean, Median, Mode & Range);and Measures of Variation(Quartiles, Interquartile Range, Outliers & Box Whisker plots)contains:11 Lessons32 Worksheets832 Problems & Tasks- and Assessment up the a$$=======================Answer KEYS included=======================Coverage Specifics:#1 Identify & Select Common Typesof Data DisplaysStudents will:1) Identi
Subjects:
Grades:
Not Grade Specific
Types:
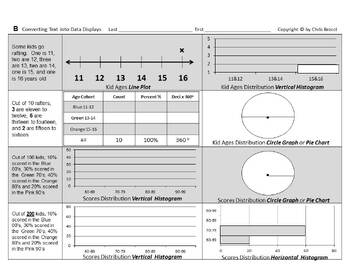
Stats&Data Slides Bundle C: Data Displays Measures of Central Tendency Variation
From the Author of Bossy BrocciMath & Big Science workbooks on Amazon,comes student fillable editable interactiveGoogle Slides™ for Google Classroom™ Students can insert/overlay text & graphics[textboxes, shapes, lines, arrows, colors etc.]onto the G-Slide image backgroundorConvert to PDF, then make it interactive onlineby using various third-party Ed. websitesorPrint it for paper worksheets=======================This Bundle of Data Displays,Measures of Central Tendency(Mean, Median, M
Subjects:
Grades:
Not Grade Specific
Types:
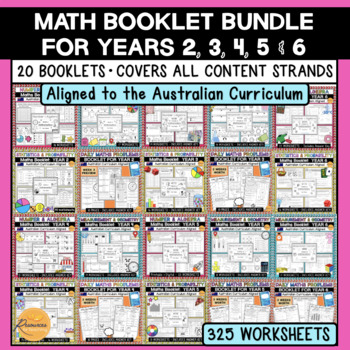
Math Worksheets and Booklets Bundle - Years 2, 3, 4, 5 & 6 Australian Curriculum
This ultimate math worksheets and booklets BUNDLE DEAL includes 325 maths worksheets (20 booklets) aligned with the Australian Curriculum and covers ALL of the syllabus outcomes and content for Year 2, 3, 4, 5 and 6 students! A MASSIVE time-saver for teachers, with a plethora of worksheets to select for classwork, revision, homework or assessment tasks throughout the school year. Excellent for classroom teachers and substitute teachers who require quick, no-prep worksheets! Please read the descr
Subjects:
Grades:
Not Grade Specific
Types:
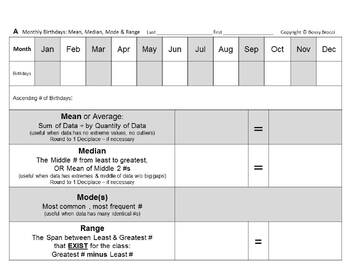
Stats&Data Slides Bundle B: Birthdays Data Displays Variation Mean Median Mode
From the Author of Bossy BrocciMath & Big Science workbooks on Amazon,comes student fillable editable interactiveGoogle Slides™ for Google Classroom™ Students can insert/overlay text & graphics[textboxes, shapes, lines, arrows, colors etc.]onto the G-Slide image backgroundorConvert to PDF, then make it interactive onlineby using various third-party Ed. websitesorPrint it for paper worksheets=======================This Birthdays Stats (Mean, Median, Mode, Range),Measures of Variation &am
Subjects:
Grades:
Not Grade Specific
Types:
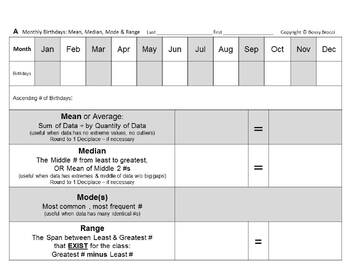
Stats&Data Bundle B: Birthdays Data Displays Variation Mean Median Mode Range
From the Author of Bossy BrocciMath & Big Science workbooks on Amazon,this Birthdays Stats (Mean, Median, Mode, Range),Measures of Variation & Data Displays Bundlecontains:2 Lessons12 Worksheets294 Problems & Tasks- and Assessment up the a$$=======================Answer KEY included=======================Coverage Specifics:#1 Author's Numbers Birthdays ProjectStudents will:1) Convert the given Monthly Birthdaysfrom Mr. Brocci's School numbers into:Ascending List/Data SetMeanMedianMod
Subjects:
Grades:
Not Grade Specific
Types:
Statistics Clipart - Graphs, Secondary Grades - BUNDLE
Need some graph clipart for your secondary grades statistics product? This clipart bundle includes 5 different clipart sets. You save 30% by buying them together.The graphs in each product come in a variety of options that make them perfect for making worksheets, assessments, interactive notebook activities, and interactive white board files!Options:1) labeled or unlabeled2) color/grayscale/blackline)These graphs, like ALL my clipart, can be used as moveable pieces in digital resources. No ad
Subjects:
Grades:
Not Grade Specific
Leadership Student Council Templates Bundle
This Leadership and Student Council ASB bundle includes all logistical documents and resources you will need to get your year started. All of these templates are editable and should be customized to fit your needs. The information on each resource is filled in so that there are examples. However, please keep in mind that specific pages need to be edited to include your school’s name, your name, expectations, dates, etc.About This Product:-Google format-6 templates:ASB Officer HandbookASB Officer
Subjects:
Grades:
Not Grade Specific
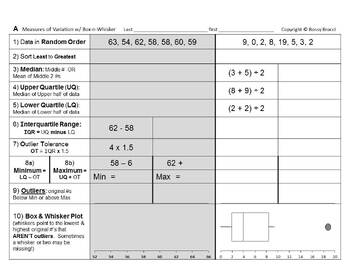
Stats&Data Slides Bundle A: Measures of Variation Box & Whisker Box Plots
From the Author of Bossy BrocciMath & Big Science workbooks on Amazon,comes student fillable editable interactiveGoogle Slides™ for Google Classroom™ Students can insert/overlay text & graphics[textboxes, shapes, lines, arrows, colors etc.]onto the G-Slide image backgroundorConvert to PDF, then make it interactive onlineby using various third-party Ed. websitesorPrint it for paper worksheets=======================This Measures of Variation Box & WhiskerBox Plots Bundlecontains:4 Les
Subjects:
Grades:
Not Grade Specific
Types:
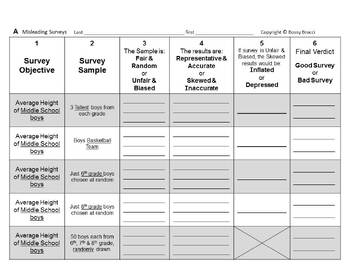
Stats&Data Bundle D: Misleading Misinterpreting Surveys Statistics Graphs Charts
From the Author of Bossy BrocciMath & Big Science workbooks on Amazon,this Bundle onMisleading & MisinterpretingSurveys, Statistics, and Graphs/Chartscontains:2 Lessons8 Worksheets78 Problems & Tasks- and Assessment up the a$$=======================Answer KEYS included=======================Coverage Specifics:#1 Misleading & Misinterpreting Surveys & Statistics+ QUIZStudents will:1) Read 10 different Surveys and Survey Samples2) Determine and Write if those Surveys are:Fair
Subjects:
Grades:
Not Grade Specific
Types:
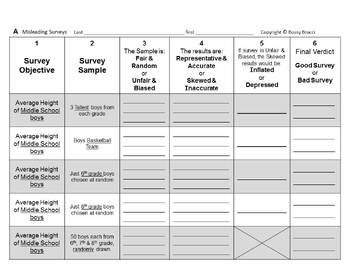
Stats&Data Slides Bundle D: Misleading Misinterpreting Surveys Statistics Graphs
From the Author of Bossy BrocciMath & Big Science workbooks on Amazon,comes student fillable editable interactiveGoogle Slides™ for Google Classroom™ Students can insert/overlay text & graphics[textboxes, shapes, lines, arrows, colors etc.]onto the G-Slide image backgroundorConvert to PDF, then make it interactive onlineby using various third-party Ed. websitesorPrint it for paper worksheets=======================This Bundle onMisleading & MisinterpretingSurveys, Statistics, and Gr
Subjects:
Grades:
Not Grade Specific
Types:
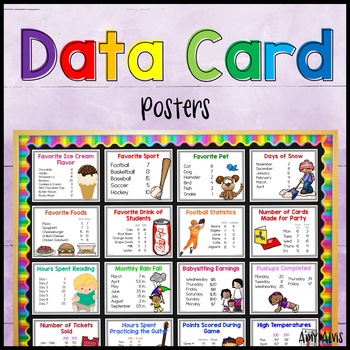
Data Cards to use with Graphing and Data Analysis
These data file cards are the perfect addition to your data analysis unit. The cards can be used to make graphs or used to calculate mean, median, mode and range.You will receive the following (each type will be a separate PDF):84 color full size data set cards84 b&w full size data set cards21 pgs of mini color data set task cards (4 per page- all different)84 pgs of mini b&w data set task cards (4 per page - all the same)The following is how I have listed the cards and their intended us
Subjects:
Grades:
Not Grade Specific
Types:
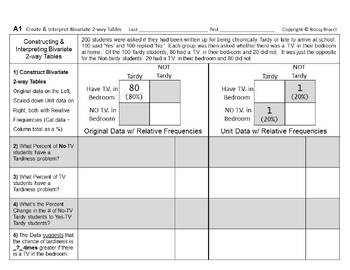
Stats&Data Slides 12: Construct Analyze Bivariate Two-way Frequency Data Tables
From the Author of Bossy BrocciMath & Big Science workbooks on Amazon,comes student fillable editable interactiveGoogle Slides™ for Google Classroom™ Students can insert/overlay text & graphics[textboxes, shapes, lines, arrows, colors etc.]onto the G-Slide image backgroundorConvert to PDF, then make it interactive onlineby using various third-party Ed. websitesorPrint it for paper worksheetsANSWER KEY included=======================Students will:1) Construct a Pair of Raw and Unit/Simpl
Subjects:
Grades:
Not Grade Specific
Types:
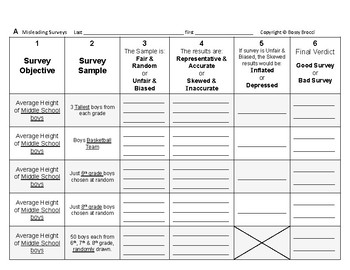
Stats&Data 13: Misleading & Misinterpreting Surveys & Statistics + QUIZ
This is an excerpt from my popular line ofBossy Brocci Math & Big Science workbooks on Amazon.ANSWER KEY included=======================Students will:1) Read 10 different Surveys and Survey Samples2) Determine and Write if those Surveys are:Fair & RandomUnfair & BiasedRepresentative & AccurateSkewed & InaccurateInflatedDepressedGood SurveyBad Survey3) Answer 24 Multiple-choice questionsbased on their Observations4) Analyze 5 Statistical Problems & Conclusions for accuracy
Subjects:
Grades:
Not Grade Specific
Types:
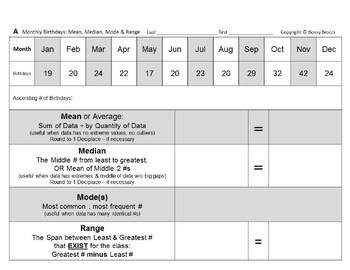
Stats&Data Slides 10: Author Birthdays Variation Central Tendency Data Displays
From the Author of Bossy BrocciMath & Big Science workbooks on Amazon,comes student fillable editable interactiveGoogle Slides™ for Google Classroom™ Students can insert/overlay text & graphics[textboxes, shapes, lines, arrows, colors etc.]onto the G-Slide image backgroundorConvert to PDF, then make it interactive onlineby using various third-party Ed. websitesorPrint it for paper worksheetsAnswer KEY included=======================Students will:1) Convert the given Monthly Birthdaysfro
Subjects:
Grades:
Not Grade Specific
Types:
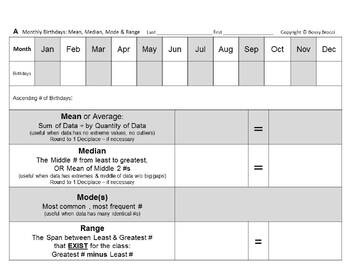
Stats&Data Slides 11: YOUR Birthdays Variation Central Tendency Data Displays
From the Author of Bossy BrocciMath & Big Science workbooks on Amazon,comes student fillable editable interactiveGoogle Slides™ for Google Classroom™ Students can insert/overlay text & graphics[textboxes, shapes, lines, arrows, colors etc.]onto the G-Slide image backgroundorConvert to PDF, then make it interactive onlineby using various third-party Ed. websitesorPrint it for paper worksheets=======================Students will:1) Convert a Monthly Birthdays tallyfrom YOUR School or Clas
Subjects:
Grades:
Not Grade Specific
Types:
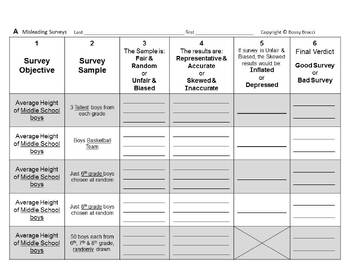
Stats&Data Slides 13: Misleading & Misinterpreting Surveys & Statistics + QUIZ
From the Author of Bossy BrocciMath & Big Science workbooks on Amazon,comes student fillable editable interactiveGoogle Slides™ for Google Classroom™ Students can insert/overlay text & graphics[textboxes, shapes, lines, arrows, colors etc.]onto the G-Slide image backgroundorConvert to PDF, then make it interactive onlineby using various third-party Ed. websitesorPrint it for paper worksheetsANSWER KEY included=======================Students will:1) Read 10 different Surveys and Survey S
Subjects:
Grades:
Not Grade Specific
Types:
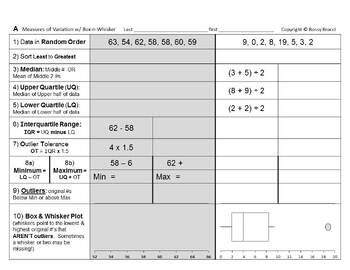
Stats&Data Slides 06: Quartiles Interquartile Range Outliers Box Whisker Plots
From the Author of Bossy BrocciMath & Big Science workbooks on Amazon,comes student fillable editable interactiveGoogle Slides™ for Google Classroom™ Students can insert/overlay text & graphics[textboxes, shapes, lines, arrows, colors etc.]onto the G-Slide image backgroundorConvert to PDF, then make it interactive onlineby using various third-party Ed. websitesorPrint it for paper worksheetsAnswer KEY included=======================Students will:1) Sort or Sequence 8 different Data Sets
Subjects:
Grades:
Not Grade Specific
Types:
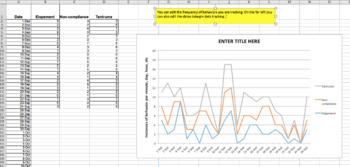
More Graphs Added! Graphing Basic Data For Students: An Excel Workbook
This is a great resource to use for data tracking for all of your students or clients. I have expanded the other Graphic Workbook on my TPT store. This resource is made to easily create graphs for a variety of skills or behaviors. As a result, this excel workbook can be used by teachers, behavior analysts, speech therapists, behavior intervention specialists, really anyone who needs data collection. The graphs can be shared during parent-teacher conferences, IEP meetings, included in student pro
Subjects:
Grades:
Not Grade Specific
Types:
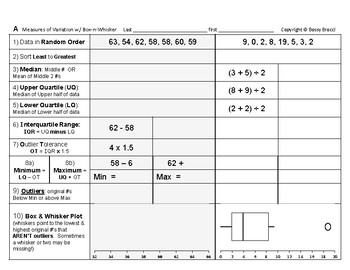
Stats&Data 06: Variation Quartiles Interquartile Range Outliers Box Whisker Plot
This is an excerpt from my popular line ofBossy Brocci Math & Big Science workbooks on Amazon.Answer KEY included=======================Students will:1) Sort or Sequence 8 different Data Sets or Sets of Numbers2) Calculate & Identify for each of the 8 Data Sets the:MedianUpper QuartileLower QuartileInterquartile RangeOutlier ToleranceAllowed MinimumAllowed Maximumandany Outliers3) Draw or Construct the Box and Whisker Plots (Box Plots)directly beneath their calculations4) Be compelled to
Subjects:
Grades:
Not Grade Specific
Types:

Guerre des clans!
Plongez-vous dans l'excitation d'un jeu télévisé avec cette adaptation palpitante du célèbre Duel de Questions ! Dans ce jeu interactif, deux équipes s'affrontent pour trouver les réponses les plus populaires à une série de sondages. Vous recevrez un fichier PowerPoint contenant 25 sondages, chacun présenté sous forme de rectangles bleus à cliquer pour révéler les réponses. ATTENTION! Assurez-vous d'avoir les feuilles de réponses des sondages à portée de main pour ouvrir les bonnes cases !Règles
Subjects:
Grades:
Not Grade Specific
Critical Thinking | Inductive Arguments + Statistics (PPT)
This Editable Presentation includes:✓ 28 Animated PowerPoint Slides✓ Clear + Organized + Accessible ContentTopics: “Inductive Arguments & Statistics” [FREE READING]ENUMERATIVE INDUCTION Sample Size Representativeness OPINION POLLS ANALOGICAL INDUCTION (arguments by analogy)Relevant Similarities Relevant Dissimilarities The Number of Instances Compared Diversity Among CasesPractice ExamplesGamblers Fallacy + Other Inductive FallaciesRebeka Ferreira's Content:✓ Like & Subscribe on YouTube✓
Grades:
Not Grade Specific
Also included in: Critical Thinking (COMPLETE - PPT Bundle)
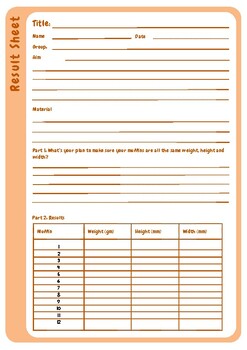
Consistency Confections: A Muffin-Baking Exploration in Product Quality
Embark on a delectable journey with 'Consistency Confections: A Muffin-Baking Exploration in Product Quality.' In this engaging activity, participants delve into the world of product consistency, a critical factor in commercial success. By immersing themselves in the art of muffin baking, participants work collaboratively in groups to select and implement methods ensuring uniform size and shape.Each group meticulously measures their muffins, and through thoughtful data analysis, participants eva
Subjects:
Grades:
Not Grade Specific
Types:
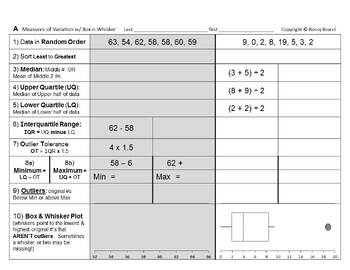
Stats&Data Bundle A: Box Whisker Box Plots & Measures of Variation bundle
Spun-off from my popular series of Bossy Brocci Math & Big Science Workbooks on Amazon,this Measures of Variation Box & WhiskerBox Plots Bundlecontains:4 Lessons10 Worksheets263 Problems & Tasks- and Assessment up the a$$=======================Answer KEYS included=======================Coverage Specifics:#1 From Quartiles Interquartile Range& Outliers to Box Whisker PlotsStudents will:1) Sort or Sequence 8 different Data Sets or Sets of Numbers2) Calculate & Identify for each
Subjects:
Grades:
Not Grade Specific
Types:
Showing 1-24 of 45 results


