26 results
Word problems Common Core HSS-ID.A.2 resources
ALGEBRA 1 - ASSESSING EVERY STANDARD (bundle)
Have you tried to find quick assessments for ALGEBRA 1?So have I! After giving up the search, I made my own. This MEGA BUNDLE provides 48 mini-assessments for all the Algebra 1, Common Core standards;Number Quantity: NQ.1-3 (3 assessments)Creating Equations: CED.1-4 (4 assessments)Reasoning with Equations and Inequalities: REI. 1,3-7, 10-12 (9 assessments)The Real Number System: RN.1-3 (3 assessments)Interpreting Functions: FIF.1-9 (9 assessments)Building Functions: FBF.1-4 (4 assessments)Linea
Subjects:
Grades:
7th - 10th
Types:
CCSS:
High School Math 1: Statistics and Interpreting Data
Task-Based Learning gets students intrinsically motivated to learn math! No longer do you need to do a song and dance to get kids interested and excited about learning. The tasks included in this unit, followed by solidifying notes and practice activities, will guarantee that students understand the concepts. This unit covers:
- Displaying one-variable data in a histogram, dot plot, or box plot
- Describing the distribution of data using statistical vocabulary
- Using data models and stati
Subjects:
Grades:
8th - 10th
Types:
CCSS:
Sports Statistics & Probability curriculum workbook (130+ pages) - Project-based
WATCH THE PREVIEW CLIP! E-MAIL ME FOR DISCOUNTS OR QUESTIONS AT MEDEIROSVINNY@YAHOO.COM.Looking to start an elective math class? Interested in project-based assessments?Tired of teaching statistics with no real-world application?This 132-page interactive workbook serves as a textbook for an introductory statistics math class; complete with Common Core standards crosswalk, embedded answers, and tons of activities and mini-projects. This workbook is the only resource I use for my 'Statistical R
Subjects:
Grades:
8th - 12th
Types:
CCSS:
STATISTICS Unit Test CC Algebra 1
The Algebra I Common Core Unit Test will assess your students’ understanding of STATISTICS
Included topics:
Graphical Displays
Quartiles
Box Plots
Measures of Central Tendency
Variation
Two Way Frequency Tables
BiVariate Data
Linear Regression
Quantifying Predictability
Residuals
This assessment can serve as a test at the end of the unit, as a diagnostic tool prior to teaching the topics or as a “test prep” activity prior to state testing.
CCSS addressed:
N-Q.1
S-ID.1
S-ID.2
S-ID.3
S-ID.5
Subjects:
Grades:
9th - 12th
Types:
CCSS:
Also included in: Algebra 1 assessments - UNIT TEST BUNDLE
High School Math Performance Tasks Bundle
Performance Tasks are high-interest activities with real world math application. These are a great way to supplement your instructional tools to engage your students, develop critical thinking skills and make connections to the real world.
Now you can save time and money with this collection of High School Performance Tasks! This easy to manage bundle includes 66 Performance Tasks, which cover 100% of Topics for High School, and an index so you can quickly find a Performance Task that covers wh
Subjects:
Grades:
9th - 12th
Types:
CCSS:
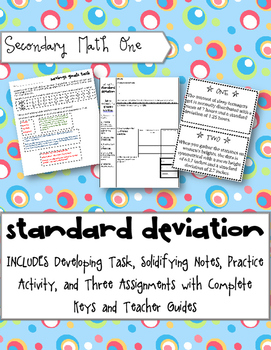
Standard Deviation Learning Cycle
This is a series of a few lessons that cover STANDARD DEVIATION using the Develop-Solidify-Practice Learning Cycle.
This download includes:
- A developing task to introduce students to the concept of standard deviation.
- Two days of solidifying notes on calculating standard deviation by hand and calculating standard deviation with technology when the data set becomes too large.
- A task cards practice activity on using standard deviation.
- Three worksheets that can be used as homework or
Subjects:
Grades:
9th - 12th
Types:
CCSS:
The Normal Distribution (Lesson with Homework)
Elementary Statistics - The Normal DistributionCommon Core Aligned Lesson Plan with HomeworkThis lesson plan includes:-Lecture Notes (PDF, PowerPoint, and SMART Notebook)-Blank Lecture Notes (PDF and SMART Notebook)-Normal Distribution Table (PDF)-Homework (PDF and Word)-Answer Key (PDF)You do not need to have PowerPoint or SMART Notebook to receive the full benefits of this product. There are also PDF versions included!Lesson Objectives:-Identify the properties of a normal distribution.-Find th
Subjects:
Grades:
10th - 12th, Higher Education
CCSS:
Also included in: Distributions of Data Lesson Plan Bundle
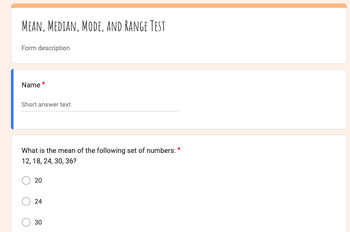
Mastery Test: Mean, Median, Mode, and Range 30 Questions Google Form
This comprehensive test on Mean, Median, Mode, and Range is designed to assess their understanding and application of these essential statistical measures. With a mix of multiple-choice and short-answer questions, this test will challenge students to think critically and demonstrate their proficiency in real-world scenarios.Test Highlights:Diverse Question Types: Our test offers a variety of question types, including multiple-choice and short-answer questions, ensuring that students are thorough
Subjects:
Grades:
6th - 9th
Types:
CCSS:
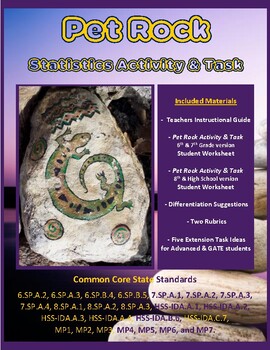
Pet Rock Statistics Activity & Task - Project Based Learning (PBL) with Math
Statistics come alive with this differentiated, student-led activity! The Pet Rock Activity & Task gives students an opportunity to gather, organize, and analyze random data. Students get creative while personalizing their own Pet Rock. Data from individual rocks is then measure, shared, compiled, analyzed, graphed, and displayed. Students will:Create a pet in the Pet Rock Activity.Use precision to weigh the rocks and record the data.Construct a graphical display of the data.Calculate numeri
Subjects:
Grades:
6th - 10th
Types:
6th-9th Grade Gummy Bear Math Activity- Data and Statistics
This is a fun (and yummy) Math activity created to review data and statistics concepts from 6th grade. Fun test practice/review! It can also be used as review or instruction for 7th-9th grades.You WILL need to buy gummy bears! Students will sort and count, then compare their bears with others.This is printable. But, included in the download is an editable Google Doc. Also, I have included a grading rubric and vocabulary sheet that can be printed for student binders/notebooks.Concepts covered:Me
Subjects:
Grades:
6th - 9th
Types:
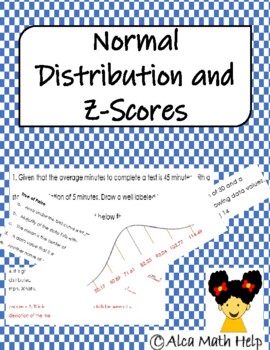
Normal Distibution and Z-Score- Statistics and AP Statistics
At the end of this activity students will be able to:•Calculate z-score and actual score/data value•Calculate standard deviation•Explain what is meant by unusual and or usual z-score•Create normal distribution curve (bell curve)•Use the 68-95-99.7 % rule to tell the regions of specific z-score •Answer sheet included!! This activity sheet can be used as a classwork, homework, pop quiz end of Unit Quiz.Marks should be personalized by teacher/users; also, students should be advised if they should s
Subjects:
Grades:
11th - 12th, Higher Education, Adult Education, Staff
Types:
CCSS:
Statistics - Algebra Math Workshop Math Games Stations
Are you looking for Math Workshop Activities to use in your Algebra classroom for Statistics that will allow you to make the best use of your planning time and easily implement Math Workshop stations because the planning is already done for you?**Want to know more? Check out the video here to learn more about the Math Workshop Concept-Based Activities!**Within this Weekly Unit, you will find 8 activities provided for you to pick and choose, or even allow a choice among your students to determine
Subjects:
Grades:
8th - 9th
Types:
CCSS:
Also included in: 7th, 8th & Algebra Grade Math Workshop Bundle Math Stations Now®️ Games
Measures of Position (Lesson with Homework)
Elementary Statistics - Measures of Position (Quartiles and Five Number Summary)Common Core Aligned Lesson with HomeworkThis lesson plan includes:-Lesson Notes (PDF, PowerPoint, and SMART Notebook)-Blank Lesson Notes (PDF and SMART Notebook)-Homework (PDF and Word)-Answer Key (PDF)You do not need to have PowerPoint or SMART Notebook to receive the full benefits of this product. There are also PDF versions included!Lesson Objectives:-Find the measures of position in a set of data. (Quartiles)-Use
Subjects:
Grades:
10th - 12th, Higher Education
CCSS:
Also included in: Introduction to Probability and Statistics Lesson Plan Bundle
Algebra 1 Spiral Review | Google Classroom Distance Learning | 2nd QUARTER
This is the DIGITAL, Google Forms version of my top-selling Algebra 1 daily spiral review resource. Also includes the DIGITAL, Google Forms version of my weekly spiral quizzes. With this one purchase, you can provide daily spiral review for your students Monday through Thursday, and assess your students on Friday. No paper. Fully Digital.WANT MORE? Save money when you purchase the Entire Year! CLICK HERE☝☝ Check out the Preview for more details and 2 FREE Weeks! ☝☝Need multiple grade levels or
Subjects:
Grades:
8th - 10th
Types:
CCSS:
Measures of Variation (Lesson with Homework)
Elementary Statistics - Measures of Variation (Range, Variation, and Standard Deviation)Common Core Aligned Lesson with HomeworkThis lesson plan includes:-Lesson Notes (PDF, PowerPoint, and SMART Notebook)-Blank Lesson Notes (PDF and SMART Notebook)-Handout (PDF and Word)-Homework (PDF and Word)-Answer Key (PDF)You do not need to have PowerPoint or SMART Notebook to receive the full benefits of this product. There are also PDF versions included!Lesson Objectives:-Describe data using measures of
Subjects:
Grades:
10th - 12th, Higher Education
CCSS:
Also included in: Introduction to Probability and Statistics Lesson Plan Bundle
BUNDLE - Performance Tasks - Data Analysis - Red Versus Blue
BUNDLE - Performance Tasks - Data Analysis - Red Versus Blue
Now you can get more options and save money with this collection of all editions of Red Versus Blue!
This set includes the Red Versus Blue Performance Task in 4 different U.S. regions. If you were to purchase each of these Performance Tasks individually, it would cost $16. At only $7, this bundle saves you about 56% off retail price!
In the Red Versus Blue Performance Task, students use data from voter turnout to practice construct
Subjects:
Grades:
9th - 11th
Types:
CCSS:
Compare Populations: Median and Interquartile Range (Common Core Aligned Lesson)
UPDATE: Now includes lecture and worksheet with editable features for Google Slides™ !Compute Median and Interquartile Range and Compare between PopulationsThis product includes a lesson plan with worksheet and answer key aligned with the common core. Review how to compute and interpret the median and interquartile range from raw data. Students also learn how to compare populations’ center and spread using the median and interquartile range, respectively, and how to summarize their conclusions.
Subjects:
Grades:
8th - 12th
Types:
CCSS:
Also included in: Bundle: Algebra 1 Statistics Unit Curriculum (Common Core)
Algebra I Final + Student-Ready Solutions (Common Core Algebra Final)
This product is part of a three-test bundle: Algebra I Testing BundleThis is a 20-question common-core aligned final exam for Algebra 1, with a student-ready solution set which can be used as a study guide with additional resources from Khan Academy.I constructed this test to align with the 20 most commonly tested Algebra 1 standards. It works well as a baseline or midterm, but I recommend instead downloading the baseline, midterm, and final which are also aligned to this baseline. This will all
Subjects:
Grades:
8th - 12th
Types:
CCSS:

BUNDLE - Performance Tasks - Correlations & Data Analysis - Voter Turnout
BUNDLE - Performance Tasks - Correlations & Data Analysis - Voter Turnout
Now you can get more options and save money with this collection of all editions of Voter Turnout!
This set includes the Voter Turnout Performance Task in 9 different state editions. If you were to purchase each of these Performance Tasks individually, it would cost $36. At only $7, this bundle saves you about 75% off retail price!
In the Voter Turnout Performance Task, students use data from voter turnout by state
Subjects:
Grades:
9th - 12th
Types:
CCSS:
Compare Populations Video Lesson: Median and Interquartile Range (Common Core)
UPDATE: Now includes Google Slides lecture and worksheet with editable features! Lesson and Video to Enable Distance Learning:Compute Median and Interquartile Range and Compare between Populations This product includes a lesson plan and video lecture with worksheet and answer key aligned with the common core. Review how to compute and interpret the median and interquartile range from raw data. Students also learn how to compare populations’ center and spread using the median and interquartile ra
Subjects:
Grades:
8th - 12th
Types:
CCSS:
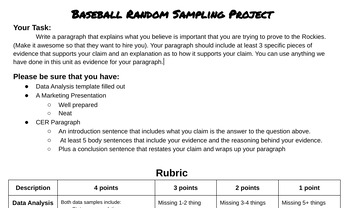
Baseball Random Sampling Project
Choosing a baseball team (based on the Rockies) students will randomly sample the team's statistics to create a presentation about how the can help the team do better and why they think so.
Subjects:
Grades:
7th - 9th
Types:
CCSS:
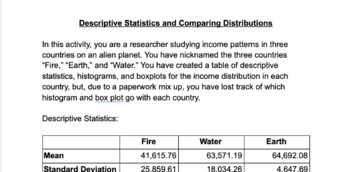
Comparing Alien Income Distributions
In this activity, students take on the role of a researcher analyzing data about the income distributions in three countries on an alien planet. In part 1, students:match descriptive statistics to histograms and box plots describing the same distributionwrite comparisons of the center/shape/spread of two distributions using relevant statistics from the graphs and tables (mean, median, standard deviation, IQR)are invited to speculate about how the actual U.S. income distribution compares to those
Subjects:
Grades:
9th - 12th
Types:
CCSS:
Also included in: Comparing Alien Income Distribution Activity and Teacher's Guide Bundle
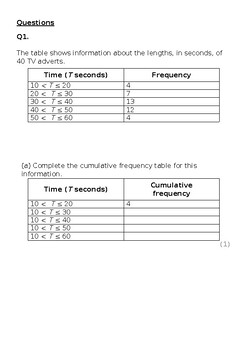
EXAM: DATA HANDLING
This exam of 155 marks follows the topic of data handling. It has twenty seven questions in a word format. It covers the topics of graphical data handling, frequency and mean, mode etc.
Subjects:
Grades:
9th - 11th
Types:
CCSS:
FREE Stat Libs Digital Statistics Vocabulary Activity
Distance Learning: FREE Stat Libs Interactive Statistics Vocabulary Activity (Common Core Aligned) This Stat Libs is a free drag-and-drop interactive activity designed with distance education in mind. Students drag and drop statistics vocabulary terms in a “Mad Libs” type activity to complete a paragraph. This activity is aligned with Common Core Standards that are typically taught in Algebra I and helps students to practice statistics terminology. Stat Libs are an easy, fun way to help students
Subjects:
Grades:
8th - 12th
Types:
CCSS:
Also included in: Bundle: Algebra I Statistics Activities (Common Core Aligned)
Showing 1-24 of 26 results


