20 results
Other (math) Common Core HSS-ID.A.2 resources
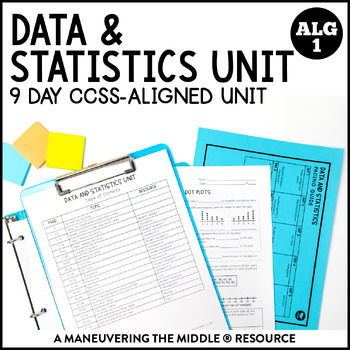
Data and Statistics Unit | Dot plots, Histograms, Box Plots, and Two-way Tables
A 9-day Data and Statistics CCSS-Aligned complete unit including mean, median, mean average deviation, standard deviation, dot plots, histograms, box plots, and two-way tables.Students will practice with both skill-based problems, real-world application questions, and error analysis to support higher level thinking skills. You can reach your students and teach the standards without all of the prep and stress of creating materials!Standards: CCSS: S.ID.1, S.ID.2, S.ID.3, S.ID.5Learning Focus:repr
Subjects:
Grades:
8th - 9th
Types:
CCSS:
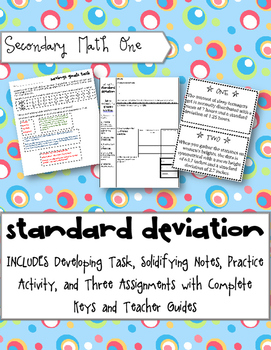
Standard Deviation Learning Cycle
This is a series of a few lessons that cover STANDARD DEVIATION using the Develop-Solidify-Practice Learning Cycle.
This download includes:
- A developing task to introduce students to the concept of standard deviation.
- Two days of solidifying notes on calculating standard deviation by hand and calculating standard deviation with technology when the data set becomes too large.
- A task cards practice activity on using standard deviation.
- Three worksheets that can be used as homework or
Subjects:
Grades:
9th - 12th
Types:
CCSS:

Alg 2 -- Probability & Statistics Review
This is a PowerPoint review that was created for Chapter 12 of the Prentice Hall Algebra 2 textbook. It includes questions about probability distributions, conditional probability, standard deviation, binomial distributions and normal distributions. The review is similar to "The Millionaire" format, so it has 15 questions.
I did not create the template, but I have added sounds, animations and videos, and re-vamped the presentation to fit my students. Every slide can be edited to be customize
Subjects:
Grades:
10th - 12th
CCSS:
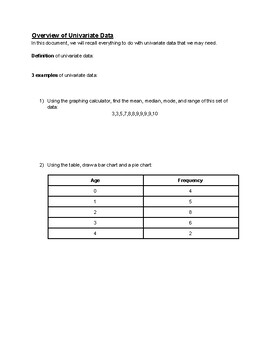
Univariate Data overview for IB Applications and Interpretations
Univariate data is usually already somewhat familiar to students in both SL and HL IB Applications and Interpretations. In this overview, students will review what they know, as well as have an opportunity to learn some simple skills that may be new to them. Everything is covered except for cumulative frequency: mean, median, mode, range, quartiles, IQR, grouped frequency tables, variance, standard deviation, box and whiskers plot, pie chart, bar chart, outliers.Students use some data gathered i
Subjects:
Grades:
10th - 12th
CCSS:
BUNDLE - Performance Tasks - Data Analysis - Red Versus Blue
BUNDLE - Performance Tasks - Data Analysis - Red Versus Blue
Now you can get more options and save money with this collection of all editions of Red Versus Blue!
This set includes the Red Versus Blue Performance Task in 4 different U.S. regions. If you were to purchase each of these Performance Tasks individually, it would cost $16. At only $7, this bundle saves you about 56% off retail price!
In the Red Versus Blue Performance Task, students use data from voter turnout to practice construct
Subjects:
Grades:
9th - 11th
Types:
CCSS:
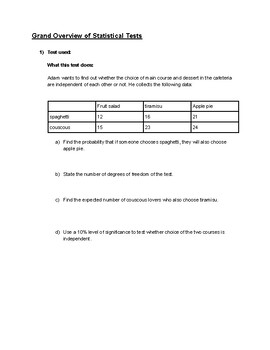
Overview of 9 statistical tests IB Applications and Interpretations Higher Level
An example for all of the 9 different types of statistical tests used in IB Higher Level Applications and Interpretations, with answers provided. Type 1 and 2 error calculations and using critical regions also included. All answers are provided.
Subjects:
Grades:
11th - 12th
Types:
CCSS:
The Data Driven Teacher
Your classroom is full of data points of which you can be made aware. The purpose of this book is to set out the methods by which you, a teacher practitioner, can collect, analyze, and use data in the context of a teaching and learning environment. It focuses on helping you develop tools to model classroom data from the following components of the classroom: student relationshipsclassroom disciplineclassroom discoursecurriculum developmentassessment of masteryThe methods this book presents to
Grades:
Not Grade Specific
Types:
CCSS:

All of the Common Core Math Standards Checklists
This is a bundle of checklists for Math Common Core Standards for all of the grades (K-12) on an excel spreadsheet with 5 columns for data input. These standards are organized in their own sub-domains to coordinate lessons. Please see my free file for an example.
Subjects:
Grades:
K - 12th
Types:

BUNDLE - Performance Tasks - Correlations & Data Analysis - Voter Turnout
BUNDLE - Performance Tasks - Correlations & Data Analysis - Voter Turnout
Now you can get more options and save money with this collection of all editions of Voter Turnout!
This set includes the Voter Turnout Performance Task in 9 different state editions. If you were to purchase each of these Performance Tasks individually, it would cost $36. At only $7, this bundle saves you about 75% off retail price!
In the Voter Turnout Performance Task, students use data from voter turnout by state
Subjects:
Grades:
9th - 12th
Types:
CCSS:

Expenses and Budgeting Quiz - 3 versions!
I wrote this quiz for Unit 1 of my Financial Algebra class. The content included in the unit includes:Type of expenses: Discretionary vs EssentialBudgeting using Excel spreadsheetsCalculating income and budget surplus/deficitHow to fix a budget that isn't balancedFinding mean, median and modeEvaluating which statistic to use to describe a set of dataThree versions of the quiz are included in this file in both docx and pdf format.
Subjects:
Grades:
7th - 12th
Types:
CCSS:

Math Common Core Standards for 9th-12th Grade
This is a checklist for all of the Math Common Core Standards for ninth through twelfth grade on an excel spreadsheet with 5 columns for data input. These standards are organized in their own sub-domains to coordinate lessons. Please see my free file for an example.
Subjects:
Grades:
9th - 12th
Types:
CCSS:
Also included in: All of the Common Core Math Standards Checklists
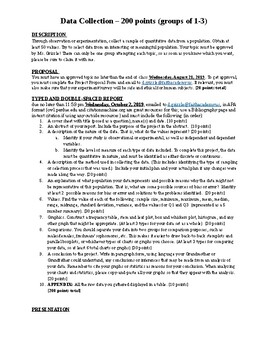
Bluman Statistics Chapters 1-3 Cumulative Project
This is a Microsoft Word document, so it can be edited to fit your own classroom needs. It is a project I used in my 12th grade Statistics class. I gave it out the second week of the quarter and set aside one day a week to work with my students on this project through all of first quarter. This project is aligned with chapters 1-3 of Elementary Statistics: A Step by Step Approach 8th edition, but can be adapted to fit any Statistics textbook. Specifically, this project includes descriptive and i
Subjects:
Grades:
11th - 12th, Higher Education
Types:
CCSS:
High School Interpreting Categorical and Quantitative Data IEP math goals
Do you feel frustrated and overwhelmed with everything on your plate? No need to sweat the small stuff. Relieve your current and future headaches with these premade IEP goals. There is no mixing and matching needed. This premade Interpreting Categorical and Quantitative Data IEP math goals packet is designed to save you valuable time, frustration, and headaches. Simply fill in the bold information to personalize each goal. This is a high school Interpreting Categorical and Quantitative Data IEP
Grades:
9th - 12th
Types:
CCSS:
Also included in: Algebra 1 IEP Math Goals
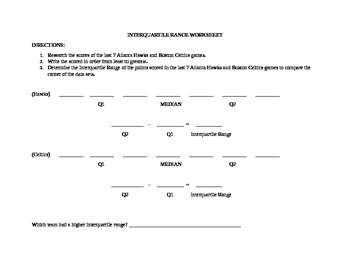
Get Sporty with Interquartile Ranges
Do you need help teaching your students about the "middle 50" in a data set? Introduce Interquartile Ranges in a fun and engaging way with this worksheet. Students will analyze the scores of the two teams and determine which has the best point spread. You can even customize the teams to feature your favorites! ♯ Please review TOU before purchasing.Be sure to look at the Preview and Thumbnails to ensure this activity aligns with your students/curriculum. If you have any questions, please contact
Subjects:
Grades:
5th - 8th
Types:
CCSS:
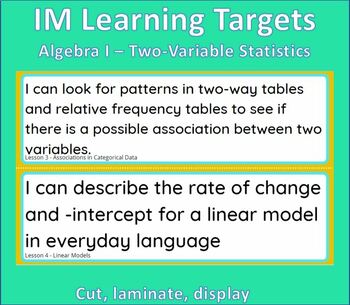
IM Learning Targets Algebra I Unit 3 - Two-Variable Statistics
Print, cut, laminate and then adhere to your objectives board in your classroom! Put magnets on the back for easy reuse.Each Learning target includes the lesson in IM that it corresponds to.Prints on legal paperCheck out the learning targets for other units6th Grade6.1 Area and Surface Area - FREE6.2 Introducing Ratios7th Grade7.1 Scale Drawings - FREE7.3 Measuring Circles7.4 Proportional Relationships and Percentages7.5 Rational Number Arithmetic7.6 Expressions, Equations, and Inequalities7.7 A
Subjects:
Grades:
8th - 9th
CCSS:
Also included in: IM Learning Targets Algebra I Bundle

Oh So Sweet Statistics - A Histogram Project
Give students the unique opportunity to not only create their own statistics, but reflect on their own progress too! We started with an estimation station each week, where I filled a new size jar with a different candy across three weeks. The student who had the lowest absolute deviation from the actual amount of candy in the jar - WON THE WHOLE JAR! After three weeks, we had more than enough candy and data to peak their interest. Students now get to use the results to engage with one variable s
Subjects:
Grades:
8th - 10th
Types:
CCSS:
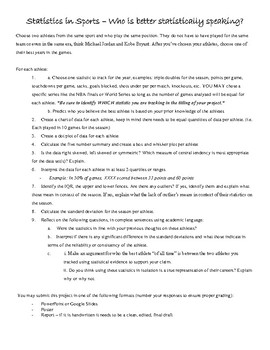
Statistics in Sports - Who is better statistically speaking?
Give students the unique opportunity to explore athletes from any sport, peak their interest, and engage with one variable statistics in a meaningful way. Just create a quick rubric based on your grading practices and let them SOAR!
Suggested to have students claim their athletes or sports events in advance to avoid too many duplicates, especially if students will be presenting their findings.
Subjects:
Grades:
8th - 10th
CCSS:
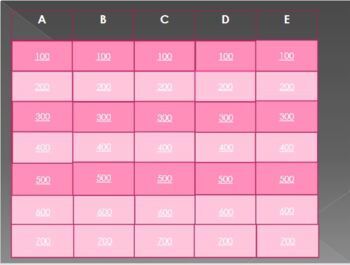
Jeopardy Game for Statistics and Probability Topics
Run out of time to create an engaging activity for your Subject Matter : Statistics and Probability? Don't worry I got you. I offer you this jeopardy game slideshow that will surely engage your students to learn this topic.In this game, there is a board containing boxes with different amounts/scores.To play this game, you can do the following:1st:Group the students2nd: Tell the students that each boxes corresponds to different questions, if they are able to give the correct answer in a particula
Subjects:
Grades:
11th
Types:
CCSS:
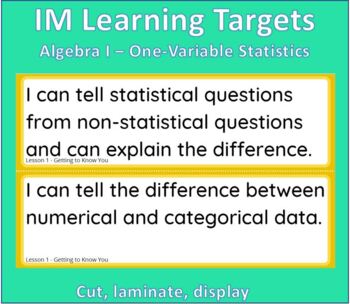
IM Learning Targets Algebra I Unit 1 - One-Variable Statistics
Print, cut, laminate and then adhere to your objectives board in your classroom! Put magnets on the back for easy reuse.Each Learning target includes the lesson in IM that it corresponds to.Prints on legal paperCheck out the learning targets for other units6th Grade6.1 Area and Surface Area - FREE6.2 Introducing Ratios7th Grade7.1 Scale Drawings - FREE7.2 Introducing Proportional Relationships7.3 Measuring Circles7.4 Proportional Relationships and Percentages7.5 Rational Number Arithmetic7.6 Exp
Subjects:
Grades:
8th - 9th
CCSS:
Also included in: IM Learning Targets Algebra I Bundle
Ohio Learning Standards (OLS) for Stats + 'I Can' Statements
Are you required to use the content standards on your lesson plans? And the 'I Can' statements? This product lists the 8 Mathematical Practices, an overview of the Statistics Learning Standards, and then the standards, each one accompanied by an 'I can' statement. The OLS are almost exactly the same as the Common Core State Standards, but for a little bit of the language and the notation. Oh, and this is FREE!
Grades:
10th - 12th
CCSS:
Showing 1-20 of 20 results


