9 results
Computer science Common Core HSS-ID.A.2 resources
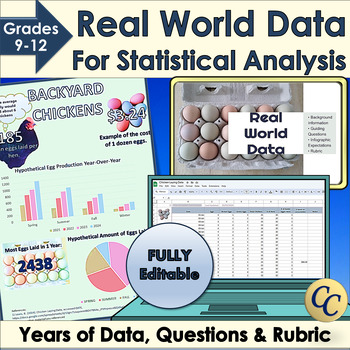
Real World Data for Statistical Analysis and Infographic Project
Give your students access to real world data for your statistical analysis unit or data literacy! Dive into statistics with Microsoft Excel™ or Google Sheets™ and years of data. Learn how to use standard deviation, mean or median to interpret data. Choose the best graphs to display conclusions in an infographic. Works great for science fairs! ✔ Includes an infographic project! (Template, expectations, and rubric). ✔ Everything is fully editable and you and your students can even use the images
Grades:
9th - 12th
Types:
CCSS:
One Variable Statistics with R Studio Computer Programming
This is a Unit on Variable Statistics using the free computer programming language R Studio. The unit features 8 lessons, 2 quizzes, and one test.Each lesson has a student google document, a teacher lesson plan, a google slides with help videos for each lesson, and R Studio Code for the lesson.The lessons cover and introduction to R Studio Programming, Data Types, Numeric Data Visualizations, Outliers, Shapes of Distributions, Spreads of Distibutions, Standard Deviation, and Comparing Data Sets.
Subjects:
Grades:
7th - 12th
Types:
CCSS:

One Variable Statistics with Python Computer Programming
This is a Unit on Variable Statistics using the free computer programming language Python which is available free using Google Colaboratory. The unit features 8 lessons, 2 quizzes, and one test. Each lesson has a student google document, a teacher lesson plan, a google slides with help videos for each lesson, and a python notebook with Python Code for the lesson written in Google Colaboratory.The lessons cover and introduction to Python Programming, Data Types, Numeric Data Visualizations, Out
Subjects:
Grades:
7th - 12th
Types:
CCSS:
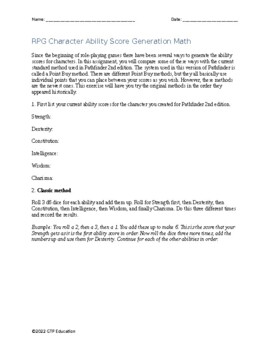
Probability Math Using Character Ability Scores in RPG Games
I created these two lessons for use in my high school game design class, but it would also work well in a math class studying probability.The first lesson takes the students through the historical methods of generating tabletop RPG character ability scores in d20 systems before the modern point buy system became prevalent. Before I do this lesson I have my students go through the process of creating an RPG character for the Pathfinder 2nd edition tabletop game with the point buy system. Pathfind
Grades:
7th - 12th
Types:
CCSS:
SPSS software Secondary Data Analysis Workshop (Introductory/AP Statistics)
This handout is intended for those interested in teaching/learning basic introductory statistics concepts to analyze real data. Students will learn how to tell a story using secondary data analysis. The handout is for SPSS and the US Longitudinal Study of Adolescent Health data set. For handouts on the data set code book and raw data file, a PowerPoint to accompany the handout, or questions please email kristin.flaming@gmail.com or ldierker@wesleyan.edu.This handout was developed as a condensed
Subjects:
Grades:
6th - 12th, Higher Education, Adult Education
Types:
Translation Code
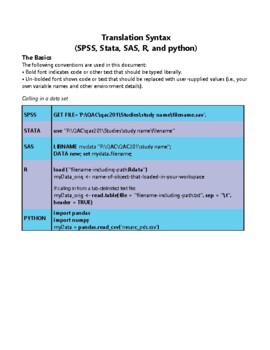
As part of our NSF-funded passion-driven statistics project, we have just started to share more widely our “translation code” aimed at supporting folks in learning code-based software and in moving more easily between them. The pdf includes all of the basic syntax for managing, displaying and analyzing data, translated across SAS, R, Python, Stata and SPSS. http://bit.ly/PDSTranslationCode.For more information about our warm and welcoming data-driven curriculum, check out https://passiondrivenst
Grades:
6th - 12th, Higher Education, Adult Education
Types:
STATA software Secondary Data Analysis
This handout is intended for those interested in teaching/learning basic introductory statistics concepts to analyze real data. Students will learn how to tell a story using secondary data analysis. The handout is for STATA software and the US Longitudinal Study of Adolescent Health data set. For handouts on setting up an account, the data set code book and raw data file, a PowerPoint to accompany the handout, or questions please email kristin.flaming@gmail.com or ldierker@wesleyan.edu.This
Grades:
6th - 12th, Higher Education, Adult Education
Types:
SAS software Secondary Data Analysis Workshop (Introductory/AP Statistics)
This handout is intended for those interested in teaching/learning basic introductory statistics concepts to analyze real data. Students will learn how to tell a story using secondary data analysis. The handout is for SAS (email for R, SPSS, Stata, & Python), a free cloud based system and the US Longitudinal Study of Adolescent Health data set. For handouts on setting up a free SAS account, the data set code book and raw data file, a PowerPoint to accompany the handout, or questions please e
Grades:
6th - 12th, Higher Education, Adult Education
Types:
R software Secondary Data Analysis Workshop (Introductory/AP Statistics)
This handout is intended for those interested in teaching/learning basic introductory statistics concepts to analyze real data. Students will learn how to tell a story using secondary data analysis. The handout is for R or R Studio, a free cloud based system and the US Longitudinal Study of Adolescent Health data set. For handouts on setting up a free R account, the data set code book and raw data file, a PowerPoint to accompany the handout, or questions please email kristin.flaming@gmail.com or
Subjects:
Grades:
6th - 12th, Higher Education, Adult Education
Types:
Showing 1-9 of 9 results

