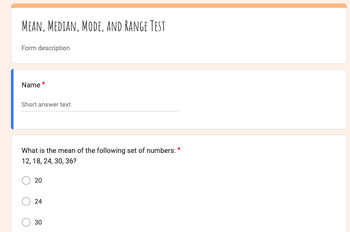
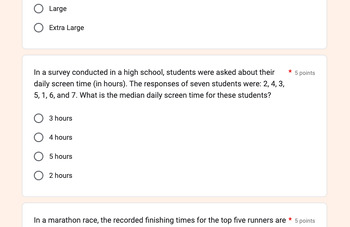
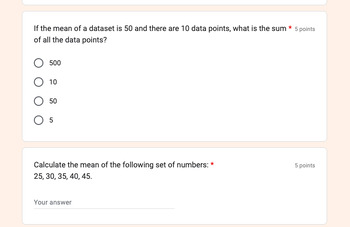
Mastery Test: Mean, Median, Mode, and Range 30 Questions Google Form
Growing Minds Inclusively
31 Followers
Grade Levels
6th - 9th
Subjects
Resource Type
Standards
CCSS6.SP.B.5
CCSS6.SP.B.5c
CCSS7.SP.B.3
CCSSHSS-ID.A.2
Formats Included
- Google Forms™
Growing Minds Inclusively
31 Followers

Made for Google Drive™
This resource can be used by students on Google Drive or Google Classroom. To access this resource, you’ll need to allow TPT to add it to your Google Drive. See our FAQ and Privacy Policy for more information.
Description
This comprehensive test on Mean, Median, Mode, and Range is designed to assess their understanding and application of these essential statistical measures. With a mix of multiple-choice and short-answer questions, this test will challenge students to think critically and demonstrate their proficiency in real-world scenarios.
Test Highlights:
- Diverse Question Types: Our test offers a variety of question types, including multiple-choice and short-answer questions, ensuring that students are thoroughly tested on their knowledge of mean, median, mode, and range.
- Real-World Scenarios: The questions in this test are inspired by real-world situations, enabling students to see the practical applications of statistical concepts in everyday life.
- Comprehensive Coverage: The test covers a range of topics, including finding the average (mean), identifying the middle value (median), determining the most frequently occurring value (mode), and calculating the range between the highest and lowest values.
- Critical Thinking: Many questions require students to analyze data, make calculations, and draw conclusions, encouraging critical thinking and problem-solving skills.
- Assessment of Mastery: This test is ideal for assessing students' mastery of statistics, whether you're introducing the concepts or reviewing them for advanced studies.
Total Pages
Answer Key
Included
Teaching Duration
N/A
Report this resource to TPT
Reported resources will be reviewed by our team. Report this resource to let us know if this resource violates TPT’s content guidelines.
Standards
to see state-specific standards (only available in the US).
CCSS6.SP.B.5
Summarize numerical data sets in relation to their context, such as by:
CCSS6.SP.B.5c
Giving quantitative measures of center (median and/or mean) and variability (interquartile range and/or mean absolute deviation), as well as describing any overall pattern and any striking deviations from the overall pattern with reference to the context in which the data were gathered.
CCSS7.SP.B.3
Informally assess the degree of visual overlap of two numerical data distributions with similar variabilities, measuring the difference between the centers by expressing it as a multiple of a measure of variability. For example, the mean height of players on the basketball team is 10 cm greater than the mean height of players on the soccer team, about twice the variability (mean absolute deviation) on either team; on a dot plot, the separation between the two distributions of heights is noticeable.
CCSSHSS-ID.A.2
Use statistics appropriate to the shape of the data distribution to compare center (median, mean) and spread (interquartile range, standard deviation) of two or more different data sets.


