469 results
Statistics Common Core 6.SP.B.5a resources
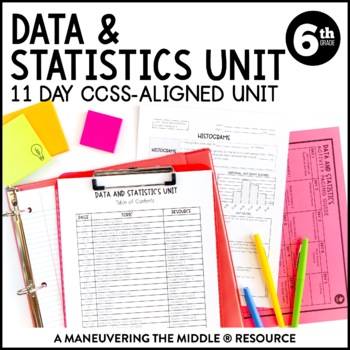
Data & Statistics Unit | Measures of Center, Dot and Box Plots, & Histograms
An 11 day CCSS-Aligned Statistics Unit - including statistical questions, describing data, and analyzing data with dot plots, box plots, and histograms. Students will understand measures of center and variability and how they relate to displays of data. Students will practice with both skill-based problems, real-world application questions, and error analysis to support higher level thinking skills. You can reach your students and teach the standards without all of the prep and stress of creatin
Subjects:
Grades:
6th
Types:
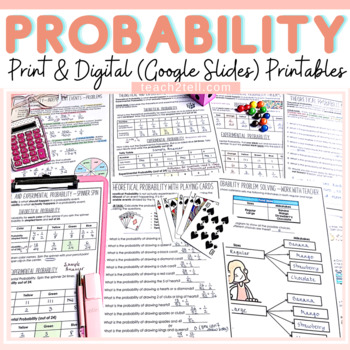
Chance and Probability Activities Print and Digital Worksheets |Google Classroom
Are you teaching your students all about chance and probability and looking for fun hands-on probability activities? This print and digital (google slides) bundle of probability worksheets will reinforce the understanding of theoretical probability, experimental probability, language of chance, sample space, predictions, lists, tree diagrams, dependent probability events and independent probability events.Both US and British English spelling and terminology included.Overview of Activities1. The
Subjects:
Grades:
4th - 8th
Types:
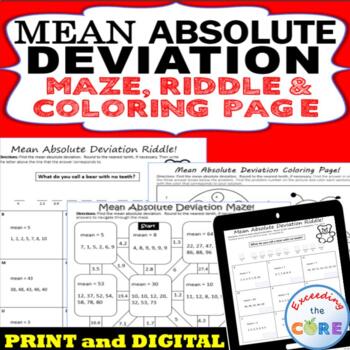
MEAN ABSOLUTE DEVIATION Mazes, Riddles & Coloring Page | Print and Digital
Have your students apply their understanding MEAN ABSOLUTE DEVIATION with these fun activities including a maze, riddle and coloring activity.What's Included:1. Mean Absolute Deviation MAZEThis is a self-checking worksheet that allows students to strengthen their understanding of finding the mean absolute deviation. Students use their answers to navigate through the puzzle.2. Mean Absolute Deviation RIDDLEStudents find the mean absolute deviation of various data sets. Students use their answer
Subjects:
Grades:
5th - 7th
Types:
Also included in: 6th Grade Math Assessments, Notes, Task Cards, Worksheets BUNDLE
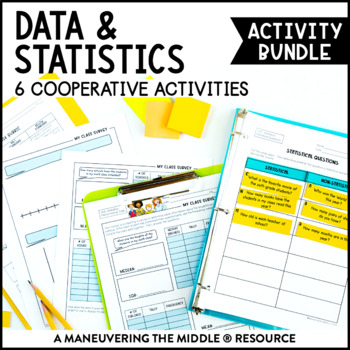
Data & Statistics Activity Bundle | Measures of Center, Histograms, & Box Plots
This Data and Statistics Activity Bundle includes 6 classroom activities to support statistical questions, histograms, box plots, measures of center and measures of variability. These hands-on and engaging activities are all easy to prep! Students are able to practice and apply concepts with these data and statistics activities, while collaborating and having fun! Math can be fun and interactive! Standards: CCSS (6.SP.1, 6.SP.2, 6.SP.3, 6.SP.4, 6.SP.5) and TEKS (6.12A, 6.12B, 6.12C, 6.12D, 6.13
Subjects:
Grades:
5th - 7th
Types:
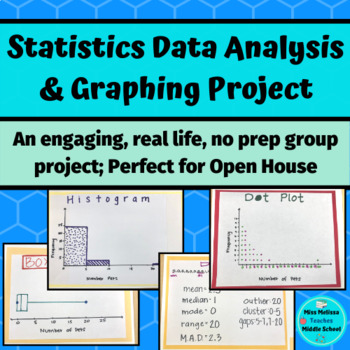
Statistics Project: Data Analysis & Graphing- real life, no prep
This statistics project is intended as a closure for your sixth grade statistics unit and aligns with ALL of the sixth grade statistics and probability common core state standards. In groups, students work together to choose a statistical question to ask the class. Once the class is surveyed, the group works together to create a frequency table, a dot plot, a histogram, and a box and whiskers plot. After creating their graphs, the groups analyze their data by looking at the mean, median, mode ra
Subjects:
Grades:
6th - 7th
Types:
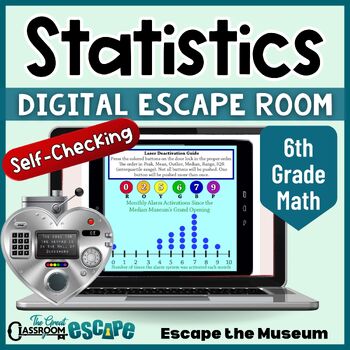
6th Grade Math Data Analysis & Statistics Activity Digital Escape Room Game
Find the median, read the box plot, interpret the frequency table, and unlock the door! This 6th grade math activity based on statistics and probability standards will put your students statistical skills to the test. Your students are volunteer docents at the Median Museum. After the security system locks everyone in, they will need to use their knowledge of statistics to escape the museum. This engaging digital escape room is easy for teachers to implement. The breakout process is fully autom
Subjects:
Grades:
6th - 7th
Types:
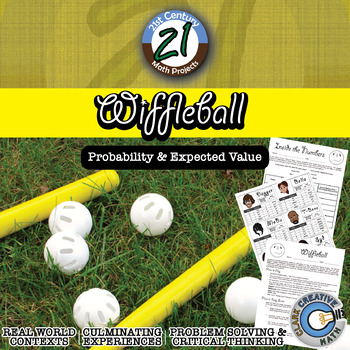
Wiffleball -- Theoretical & Experimental Probability - 21st Century Math Project
Theoretical and Experimental Probability gets a 21st Century Math Project facelift in this interactive game. Tired of flipping coins and spinning spinners? Students play the role of team managers and with only player statistics they must build a team capable of winning the championship. Students will plays a series of Wiffleball games where they will keep track of statistics using a baseball/softball inspired scorebook and after the game crunch the number to see if their players performed up to
Subjects:
Grades:
6th - 12th
Types:
Also included in: Probability & Expected Value Unit Bundle - Distance Learning Compatible
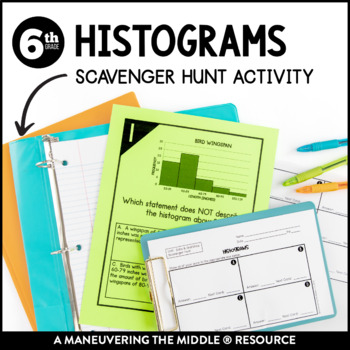
Histograms Scavenger Hunt | Interpreting Histograms Activity
This Histograms Scavenger Hunt consists of 10 clue cards where students must use the clue to interpret histograms. This activity focuses on analyzing histograms and determining which statements are represented in the histogram. This activity is great for in class practice! Students can get out of their seats and move around, while still applying their understanding of data and statistics. Students are able to practice and apply concepts with this histograms activity, while collaborating and havi
Subjects:
Grades:
5th - 7th
Types:
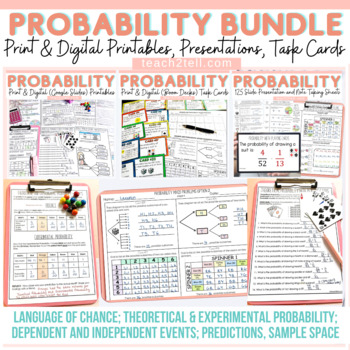
Chance and Probability Activities Theoretical & Experimental Probability Bundle
Are you teaching your students all about chance and probability and looking for fun hands-on probability activities? This print and digital bundle of worksheets, task cards, slideshows and note-taking sheets on Probability will reinforce the understanding of theoretical probability, experimental probability, language of chance, sample space, predictions, lists, tree diagrams, dependent probability events and independent probability events.Both US and British English spelling and terminology file
Subjects:
Grades:
4th - 7th
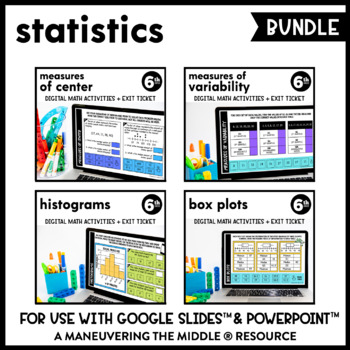
Statistics Digital Math Activity Bundle | Measures of Center | Google Slides
These supplemental digital math activities can be used to support data and statistics concepts. They are interactive (drag and match, using the typing tool, using the shape tool) and paperless through Google Slides™ and PowerPoint™. Topics Included:Measures of Center (4 interactive slides + exit ticket)Measures of Variability (4 interactive slides + exit ticket)Histograms (4 interactive slides + exit ticket)Box Plots (4 interactive slides + exit ticket)What is included?1. Paperless Math Activit
Subjects:
Grades:
6th
Types:
Statistics & Data Display Project for 6th Grade Math PBL (Fully Editable)
This product includes a student guide for a 6th grade middle school mathematics project that will require students to develop a statistical question, conduct a survey with their classmates, create numerical summaries, represent their findings using visual data displays, and finally present their findings! The thorough student guide provides step by step directions for each part of the project and could be used as either an in class project or to be assigned as homework. The student guide also in
Analyzing Plots, Graphs, and Tables using Measures of Central Tendency
This product provides students the opportunity to analyze data presented in different ways. By making calculations and analyzing data, students make conjectures and justify them using mathematical reasoning and evidence!What is included?This product contains 8 student work pages. Each work page contains a set of data displayed graphically with accompanying questions. The data displays included are 2 dot plots, 2 bar graphs, 2 frequency tables, and 2 stem-and-leaf plots. Students are required
Subjects:
Grades:
5th - 11th
Types:
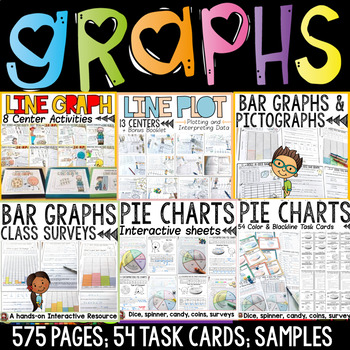
Bar Graphs Pictographs Line Graphs Line Plots Pie Charts Data Collection Bundle
The graphing bundle features interactive activities for creating and interpreting bar graphs, pictographs, line graphs, line plots and pie charts. Your entire graphing unit for a year!Separate folders featuring both British English and US spellings and terminology included.Great quality and value for this whopping 575 + page unit on graphing! Data is collected and interpreted using concrete materials such as visuals, dice, spinners, coins and other real-life objects and contexts. Further details
Subjects:
Grades:
2nd - 6th
Types:
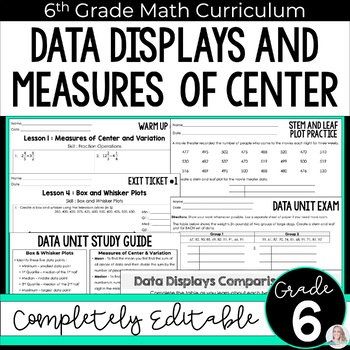
Data Displays Unit 6th Grade Math Curriculum
6th Grade Data Unit - Completely editable to help you best meet the needs of your students!Click here to purchase the digital notebook version of this unit. 6th Grade Math Curriculum Unit 7 {Buy the full curriculum HERE}This unit includes five multi-day lessons that the following skills :Measures of Center and VariationLine Plots and Stem and Leaf PlotsFrequency Tables and HistogramsBox and Whisker PlotsCharacteristics of Data DisplaysIncluded in this resource: Google Forms versions of the asses
Subjects:
Grades:
6th
Also included in: 6th Grade Math Curriculum: Comprehensive, Engaging & Standards-Aligned
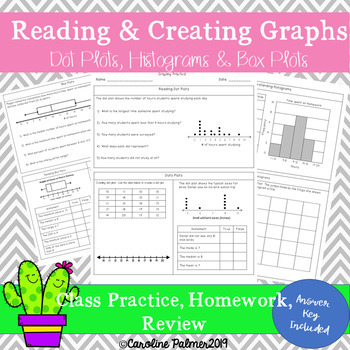
Reading and Drawing Graphs-Box Plot, Dot Plot and Histograms
A review of how to read graphs. Students will answer questions about box plots, dot plots and histograms. There is a set of open response and true or false questions for each section. There is one page for each topic. Students will also create each type of graph from a data set.An answer key is included.
Subjects:
Grades:
6th
Types:
Histogram Hike - Google Slides and PDF Versions
Want to make histograms fun and keep your student active?Just cut out these 14 histograms/data tables, and post them around the perimeter of your classroom. Place one or two students at each station. Your students will read the question, interpret the data display, and record their answers next to the corresponding number on their papers. And now, your purchase also includes a Google Slides version for Distance Learning! You will need a Google account to access this version.There is also a k
Subjects:
Grades:
5th - 7th
Types:
Mean, Median, Mode, and Range (Bundled Unit) - Distance Learning
This is an enjoyable, interactive, and engaging bundled unit covering mean, median, mode, and range (and introduces outliers). This unit is great for 5th and 6th graders and 7th graders who struggle with these concepts.Included in this bundled unit:PowerPointAnimated and fun 4-part, 21-slide PowerPoint (multi-day use)-Part 1 – The Meaning of Mean-Part 2 – Getting in the Middle of Median-Part 3 – Making the Most of Mode-Part 4 – Home, Home on the RangeEach section offers plenty of practice probl
Subjects:
Grades:
5th - 7th
Math Color by Number - Histograms - Fun!
I'm making it my mission to take some of the most irrelevant, abstract concepts for students, and turning them into FUN color-by-number activities. Why should these fun coloring activities stop once kids leave elementary school? Watch your students actually care about their answers as they quietly work to color each picture correctly. You can assess their progress quickly, just by glancing to see if they colored their pictures correctly.The directions for students are as follows: Complete the pr
Subjects:
Grades:
6th
Types:
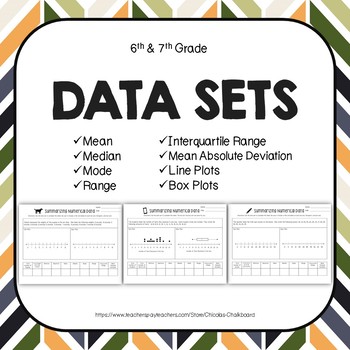
Data Sets: Mean, Median, Mode, Range, Interquartile Range, Box Plots, Dot Plots
Using this activity, students will be able to analyze data sets using box plots and dot plots. They will find the following: minimum, maximum, mean, median, mode, range, interquartile range, and mean absolute deviation. They will also create the box plots and dot plots using the data provided. This set includes: -Common Core State Standards-Two Reference Sheets (Key Data Set Terms and How to Create a Box Plot)-Four Different Data Worksheets 1. One data sheet that includes a completed dot p
Subjects:
Grades:
5th - 7th
Types:
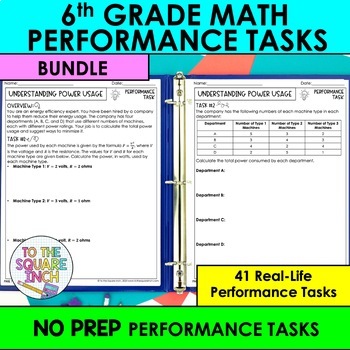
6th Grade Math Performance Tasks Bundle
Included in this product:*41 different 2 page performance tasks that cover the topics in the 6th Grade Math Common Core Standards* Each task is based on a real-life situation. *Answer KeysTopics covered: Equivalent ratios, unit rate, ratio tables, percents, unit conversions, area of parallelograms, triangles and trapezoids, volume of rectangular prisms, polygons on the coordinate plane, area and length on the coordinate plane, surface area of rectangular prisms and surface area of pyramids, expo
Subjects:
Grades:
6th
Types:
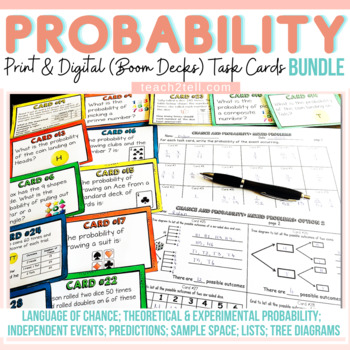
Theoretical Probability Activities Print Digital Task Cards Boom Cards Bundle
Are you teaching your students all about Theoretical Probability and looking for fun hands-on Chance and Probability activities? This print and digital (Boom Decks) bundle of 192 probability task cards will reinforce the understanding of theoretical probability, experimental probability, language of chance, sample space, predictions, lists, tree diagrams and independent probability events.Please see the preview file for more information.Both US and British English spelling and terminology includ
Subjects:
Grades:
4th - 8th
Types:
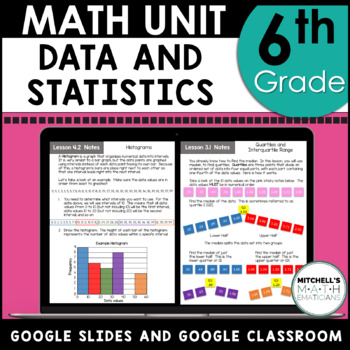
6th Grade Math Data and Statistics Curriculum Unit 7 Using Google
In this NO PREP Google Drive product you get an entire unit that covers: statistical questions; categorical and numerical data; frequency tables; line plots; dot plots; mean, median, mode, and range; outliers; quartiles and interquartile range (IQR); mean absolute deviation (MAD); bar graphs; histograms; box-and-whiskers plots; and much more . All you have to do is share the file with your students and they can get started. Text boxes are included so your students know where to type their answer
Subjects:
Grades:
6th - 7th
Types:
Also included in: 6th Grade Math Curriculum Bundle CCSS Aligned
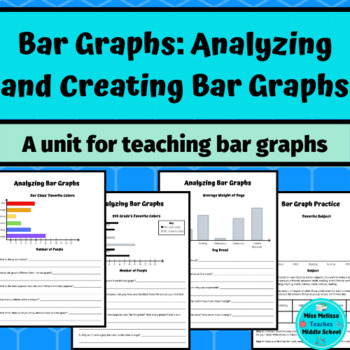
Statistics: Bar Graphs Mini Unit: Analyzing and Creating Bar Graphs
Students learn how to create a bar graph by first analyzing and reading bar graphs. Students analyze horizontal, vertical, and double bar graphs. They compare their qualities and answer questions about the data in the graphs and features of the graphs. They inspect titles, the quantities represented by the bars, and the x and y-axis values/labels. Once students are familiar with the concept and features of a bar graph, they create a bar graph from given data. This can be used as guided practice.
Subjects:
Grades:
4th - 7th
Mean, Median, Mode, Histograms, Box Plots | Math Escape Room | Digital and Print
Do you love using Escape Room activities, but hate the prep? Then look no further, this resource is low prep and highly engaging. It can be used with or without technology and requires no lockboxes or elaborate setups! Essentially, students will work through 5 levels of rigorous questions and along the way gather a 5-digit code to unlock the next level. If you use technology, they will type it into the Google Form, but if you are not using technology, you would just check their 5-digit code with
Subjects:
Grades:
6th - 7th
Types:
Also included in: Math Escape Room Bundle | 6th Grade | Digital and Print
Showing 1-24 of 469 results


