144 results
Graphing Common Core 6.SP.B.5a resources
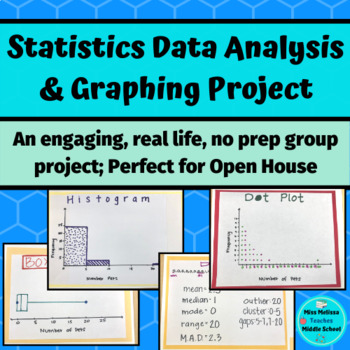
Statistics Project: Data Analysis & Graphing- real life, no prep
This statistics project is intended as a closure for your sixth grade statistics unit and aligns with ALL of the sixth grade statistics and probability common core state standards. In groups, students work together to choose a statistical question to ask the class. Once the class is surveyed, the group works together to create a frequency table, a dot plot, a histogram, and a box and whiskers plot. After creating their graphs, the groups analyze their data by looking at the mean, median, mode ra
Subjects:
Grades:
6th - 7th
Types:
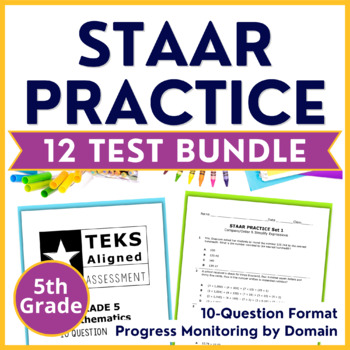
5th Grade Math STAAR Practice Bundle - Progress Monitoring by Domain
Make sure your students are mastering the grade-level standards. These TEKS & STAAR Aligned 10-Question Assessments are easy to incorporate as quick checks, review, practice, progress monitoring, guided math, and STAAR test-prep! These STAAR Practice assessments are grouped by related standards/topics allowing for targeted practice. The 10-question format makes test prep, review, and practice much more manageable!⭐ This resource is now available for Google Drive! IF YOU WOULD PREFER THE NEW
Subjects:
Grades:
5th
Types:
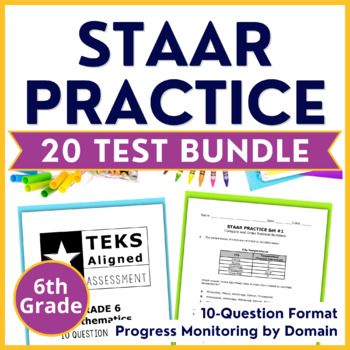
6th Grade Math STAAR Practice Bundle - Progress Monitoring by Domain
Make sure your students are mastering the standards at a rigorous high-stakes testing level. These TEKS & STAAR Aligned 10-Question Assessments are easy to incorporate as quick checks, review, practice, progress monitoring, guided math, intervention, and STAAR test-prep! These STAAR Practice assessments are grouped by related standards/topics allowing for targeted practice. The 10-question format makes test prep, review, and practice much more manageable!⭐ This resource is now available for
Subjects:
Grades:
6th
Types:
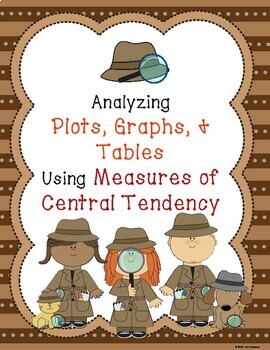
Analyzing Plots, Graphs, and Tables using Measures of Central Tendency
This product provides students the opportunity to analyze data presented in different ways. By making calculations and analyzing data, students make conjectures and justify them using mathematical reasoning and evidence!What is included?This product contains 8 student work pages. Each work page contains a set of data displayed graphically with accompanying questions. The data displays included are 2 dot plots, 2 bar graphs, 2 frequency tables, and 2 stem-and-leaf plots. Students are required
Subjects:
Grades:
5th - 11th
Types:
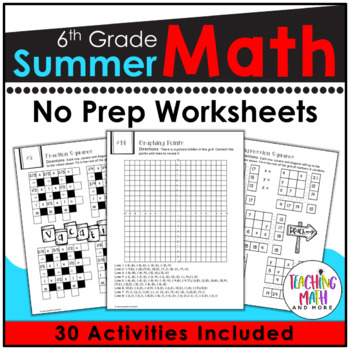
6th Grade Summer Packet | Summer Math Worksheets Grade 6
Need to review math skills? A Summer Math packet that your 6th grade students will want to complete! This packet is FUN and FULL of sixth-grade math problems. Students love the fun coloring, puzzles, and problem solving activities. Save 30% on this resource in the 6th grade math worksheets for the year!How to use it:1. A fun review at the end of 6th grade during May & June or after testing!2. A summer packet for students to complete at home during June, July, & August!3. A beginning of 7
Subjects:
Grades:
6th - 7th
Types:
Also included in: Math Worksheets 6th Grade BUNDLE
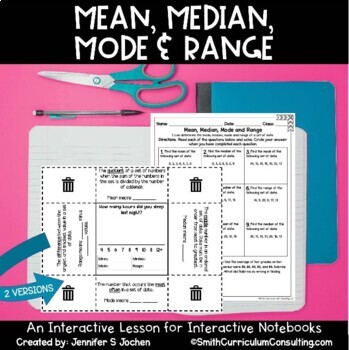
Mean, Median, Mode and Range Foldable Interactive Notebook Lesson with Practice
Ready to review the basics of Mean, Median, Mode and Range? This flippable has all that you need for your students to have a resource for the definition, a keyword to help them remember, as well as a graph to compile data from the class and determine the Mean, Median, Mode, and Range for your class data!Includes:Teacher Directions with a full-color photoMean, Median, Mode, and Range Foldable (2 versions)Mean, Median, Mode, and Range Practice SheetMean, Median, Mode, and Range Practice Sheet Answ
Subjects:
Grades:
5th - 7th
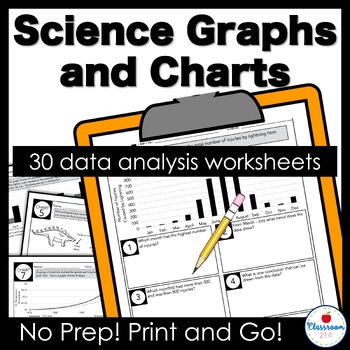
Middle School Data Analysis Reading Graphs Worksheets
Reading graphs and interpreting data is challenging. Teach your science students to master comprehending and analyzing charts, graphs, and diagrams in just a few minutes a day! This mega pack gives students a graph or chart and five questions to help them read and analyze it.***This is the print version.***Click here to see the print and digital bundle with four FREE bonus charts!If your students are like mine, they collected data well during a scientific investigation, but struggle to underst
Subjects:
Grades:
4th - 8th
Types:
NGSS:
MS-LS4-3
, MS-LS4-1
, MS-ETS1-4
, MS-LS2-1
, MS-ETS1-3
Also included in: Middle School Science Graphs Worksheets Print and Digital Bundle
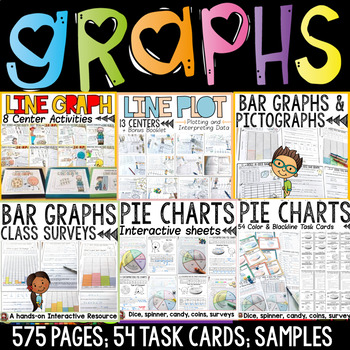
Bar Graphs Pictographs Line Graphs Line Plots Pie Charts Data Collection Bundle
The graphing bundle features interactive activities for creating and interpreting bar graphs, pictographs, line graphs, line plots and pie charts. Your entire graphing unit for a year!Separate folders featuring both British English and US spellings and terminology included.Great quality and value for this whopping 575 + page unit on graphing! Data is collected and interpreted using concrete materials such as visuals, dice, spinners, coins and other real-life objects and contexts. Further details
Subjects:
Grades:
2nd - 6th
Types:
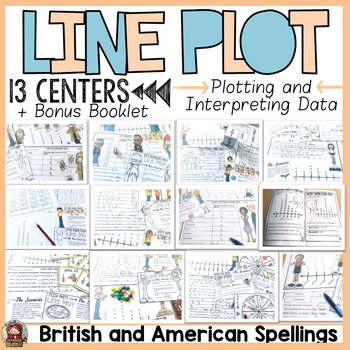
Line Plots With Fractions and Whole Numbers
Interpreting data in Line Plots with fractions and whole numbers feature 13 center interactive activities. Students will work with fractions of a unit and whole numbers to collate and display data using interactive materials like visual cards, dice, spinners, candy, coins, and other real-life data. Items Included13 center Activities (color and blackline): for each center activity students will follow the instructions on a task card to plot data on a line plot and interpret data plotted on a resp
Subjects:
Grades:
3rd - 7th
Types:
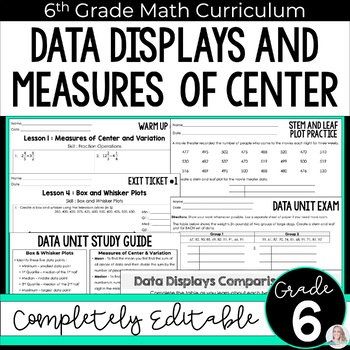
Data Displays Unit 6th Grade Math Curriculum
6th Grade Data Unit - Completely editable to help you best meet the needs of your students!Click here to purchase the digital notebook version of this unit. 6th Grade Math Curriculum Unit 7 {Buy the full curriculum HERE}This unit includes five multi-day lessons that the following skills :Measures of Center and VariationLine Plots and Stem and Leaf PlotsFrequency Tables and HistogramsBox and Whisker PlotsCharacteristics of Data DisplaysIncluded in this resource: Google Forms versions of the asses
Subjects:
Grades:
6th
Also included in: 6th Grade Math Curriculum: Comprehensive, Engaging & Standards-Aligned
5th Grade TEKS Math STAAR Practice Test-Prep Bundle | Digital + Print
Make sure your students are mastering the standards. These TEKS-Aligned Pre-Post 10 Question Assessments are easy to incorporate as quick checks, review, practice, progress monitoring, guided math, and test-prep! This version also includes self-grading Google Forms format!These STAAR Practice assessments are grouped by related standards/topics allowing for targeted practice. The 10-question format makes test prep, review, and practice much more manageable! Use throughout the year to monitor prog
Subjects:
Grades:
5th
Types:
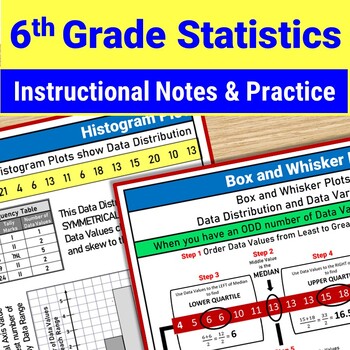
6th Grade Statistics Project Box Plot Mean Median Mode Range Histogram Activity
Teach all 6th Grade Statistics and Probability Standards with this 10-day Instructional Notes and Practice Unit. Calculate Measures of Central Tendency (mean, median, mode, range) and Mean Absolute Deviation. Master Data Display with Box and Whisker Plots, Histograms, Dot Plots, Stem and Leaf Charts. Write Statistical Questions. Analyze Data Distribution and Data Variability. No need to dread teaching 6th Grade Statistics because your textbook does a mediocre job of explaining how to calculate a
Subjects:
Grades:
6th - 8th
NGSS:
MS-ETS1-2
Histogram Hike - Google Slides and PDF Versions
Want to make histograms fun and keep your student active?Just cut out these 14 histograms/data tables, and post them around the perimeter of your classroom. Place one or two students at each station. Your students will read the question, interpret the data display, and record their answers next to the corresponding number on their papers. And now, your purchase also includes a Google Slides version for Distance Learning! You will need a Google account to access this version.There is also a k
Subjects:
Grades:
5th - 7th
Types:
6th Grade Daily Math Reviews Weeks 1-5
Help your students keep their math skills sharp with a daily, spiral review. 6th Grade Daily Math Reviews include 25 reproducibles to be used as a daily math warm-up. Each week contains daily reviews (A-D) and a quiz for Friday. Weeks 1-5 review basic computation along with focusing on the Statistics and Probability Common Core math standards including dot plots, histograms, and box plots. Basic computation practice includes long division, multi-digit multiplication, order of operations, fra
Subjects:
Grades:
6th
Types:
Also included in: 6th Grade Math Daily Review Bundle Weeks 1-35
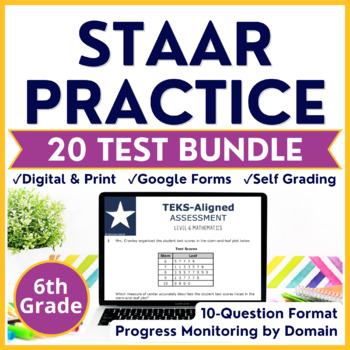
6th Grade Math TEKS-STAAR Practice Bundle | Digital Resource + Print
Make sure your students are mastering the standards at a rigorous high-stakes testing level. These TEKS & STAAR Aligned 10-Question Assessments are easy to incorporate as quick checks, review, practice, progress monitoring, guided math, and STAAR test-prep!These STAAR Practice assessments are grouped by related standards/topics allowing for targeted practice. The 10-question format makes test prep, review, and practice much more manageable! Use throughout the year to monitor progress and as
Subjects:
Grades:
6th
Mean, Median, Mode, Histograms, Box Plots | Math Escape Room | Digital and Print
Do you love using Escape Room activities, but hate the prep? Then look no further, this resource is low prep and highly engaging. It can be used with or without technology and requires no lockboxes or elaborate setups! Essentially, students will work through 5 levels of rigorous questions and along the way gather a 5-digit code to unlock the next level. If you use technology, they will type it into the Google Form, but if you are not using technology, you would just check their 5-digit code with
Subjects:
Grades:
6th - 7th
Types:
Also included in: Math Escape Room Bundle | 6th Grade | Digital and Print
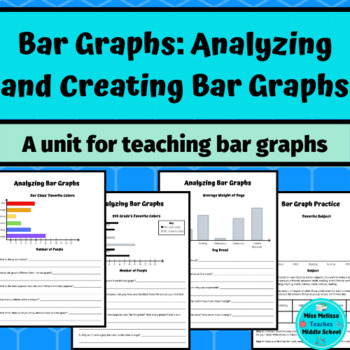
Statistics: Bar Graphs Mini Unit: Analyzing and Creating Bar Graphs
Students learn how to create a bar graph by first analyzing and reading bar graphs. Students analyze horizontal, vertical, and double bar graphs. They compare their qualities and answer questions about the data in the graphs and features of the graphs. They inspect titles, the quantities represented by the bars, and the x and y-axis values/labels. Once students are familiar with the concept and features of a bar graph, they create a bar graph from given data. This can be used as guided practice.
Subjects:
Grades:
4th - 7th
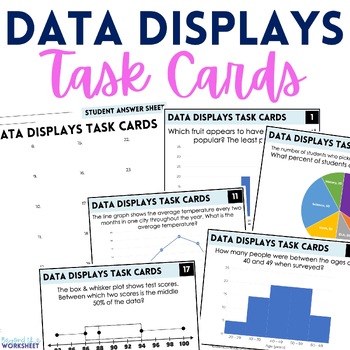
Data Displays Task Cards
⭐️ This set of math task cards will help assess student understanding of interpreting data displays. 28 task cards are included. ⭐️ Skills covered: HistogramsBox and whisker plotsBar graphsCircle graphs Line graphs. ✅ Students are asked to interpret these data displays, not create them!Available in the following bundles : Middle School Math Task Cards Bundle6th Grade Math Supplemental Activities Bundle6th Grade Data Displays Activity BundleLicensing Terms :By purchasing this product, you own a l
Subjects:
Grades:
6th - 8th
Types:
Also included in: 6th Grade Math Curriculum Supplemental Activities Bundle
Football Stats Math Project - Upper Elementary Math: Graphing and Analyzing Data
This Football Stats Project incorporates the use of line plots, stem and leaf plots, analyzing upward and downward trends in data and median, mode, range and outliers. I also incorporated discussion and higher order thinking skills. Students will apply these concepts and skills to football statistics that they will research - included are suggestions for websites to research and topics to research.This would be best for 4th, 5th or 6th grade math students.This resource includes slides that intro
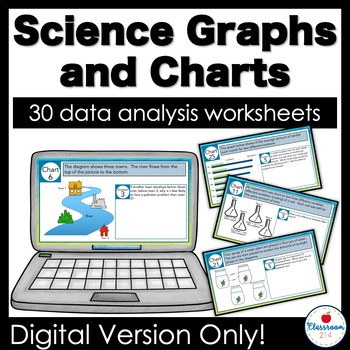
Middle School Science Digital Graphs Worksheets
Teach your students to master comprehending and analyzing charts, graphs, and diagrams in just a few minutes a day! This digital mega pack of charts, graphs, tables, and diagrams includes five questions to go with each data set. Use with Google™ Slides.***This is the digital version only.***Click here to see the print and digital bundle with four FREE bonus charts.If your students are like mine, they collect data well during a scientific investigation, but struggle to understand and interpret
Subjects:
Grades:
4th - 8th
Types:
NGSS:
MS-LS4-3
, MS-LS4-1
, MS-ETS1-4
, MS-LS2-1
, MS-ETS1-3
Also included in: Middle School Science Graphs Worksheets Print and Digital Bundle
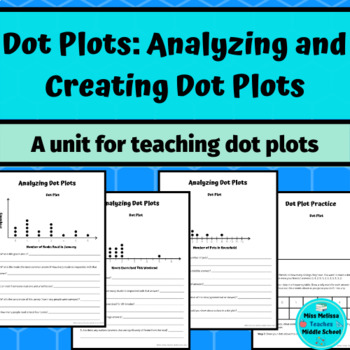
Teaching Dot Plots Mini Unit: Analyzing and Creating Dot Plots
Students learn how to create a dot plot by first analyzing dot plots. Students answer questions about the graphs to discover qualities about the dot plots. Students discover the axes, sample size, mean, median, mode, range, outliers, distribution, and other statistical terms through their analysis. Once students are familiar with the concept and features of a dot plot, they create their own from given data. This can be used as guided practice. After, students create a frequency table and dot plo
Subjects:
Grades:
4th - 6th
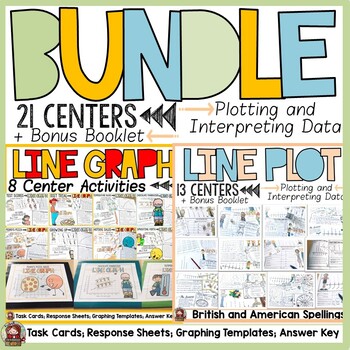
Line Graphs and Line Plots With Fractions and Whole Numbers Centers Bundle
Line Graphs and Line Plots with fractions and whole numbers feature interactive center activities. Data is collected using concrete materials such as visuals, dice, spinners, coins and other real-life objects and contexts. Further details about the graphs featured in this bundle are:1. LINE GRAPHSThis is a 145 page unit on Line Graphs that contains visual interactive activities to collate, record and interpret data in line graphs. Items Included8 center Activities (color and blackline): for eac
Subjects:
Grades:
3rd - 7th
Types:
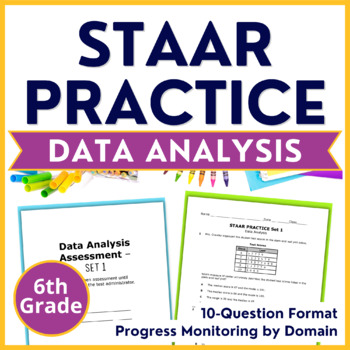
6th Grade Math STAAR Practice Data Analysis - Progress Monitoring by Domain
Make sure your students are mastering the grade-level standards at a rigorous high-stakes testing level. These TEKS & STAAR Aligned 10 Question Assessments are easy to incorporate as quick checks, review, practice, progress monitoring, guided math, intervention, and test prep! These STAAR Practice assessments are grouped by related standards/topics allowing for targeted practice. The 10-question format makes test prep, review, and practice much more manageable!⭐ This resource is now availabl
Subjects:
Grades:
6th
Types:
Also included in: 6th Grade Math STAAR Practice Bundle - Progress Monitoring by Domain
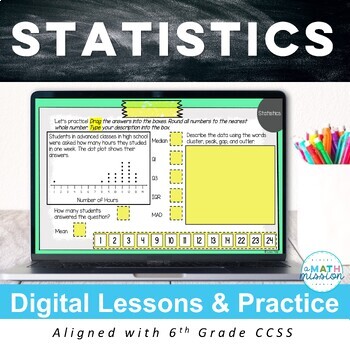
Statistics Unit Digital Lessons & Practice Activities for use with Google™
Engage your students and save yourself time with these distance learning lessons. These digital activities guide students through all the 6th grade common core statistics & probability standards. Informational lesson pages are intertwined with interactive learning activity slides. Students drag and drop or type in answers on the Google Slides. Great alternative to worksheets! These can be used in so many ways: math centers, stations, extra practice, as a teacher guided lesson or for students
Showing 1-24 of 144 results


