10 results
Computer science Common Core 6.SP.B.5a resources
Sponsored
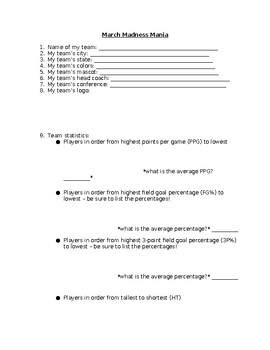
NCAA March Madness Basketball Tournament Team Research Statistics
Do you have students interested in the March Madness basketball tournament? Then this is the activity you need!To begin our March Madness unit, we look at all of the teams participating in the tournament and complete a map together to show where each team is from. We notice that some states have more than others and some states have none, and spend time discussing why that might be. Students will complete their own March Madness bracket.Students will then select a team in the NCAA March Madness
Grades:
4th - 9th
Types:
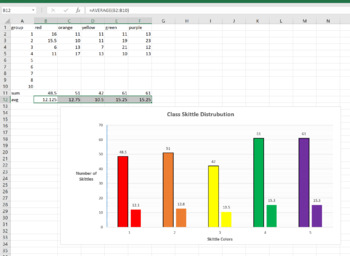
Skittle Statistics MS Excel Mini-Lab
This is a 1 class MS Excel lab for a computer or math class. You can have the students explore the distribution of different color Skittles in class. This is a great mini-lab or half-day activity when you school ends up with a weird schedule day. Tell them they can't eat till the Skittles till the end of class, or they will distort their numbers. Also make sure they don't throw them or shove them up their nose (Yes, stuck Skittles are hard to extract, ask me how I know..)The goal of this lab is
Grades:
6th - 12th, Higher Education, Adult Education
Types:
NGSS:
MS-ETS1-2
, HS-ETS1-2
, HS-ETS1-3
, MS-ETS1-4
, MS-ETS1-1
...
Also included in: Hands-on Science Semester Labs Bundle
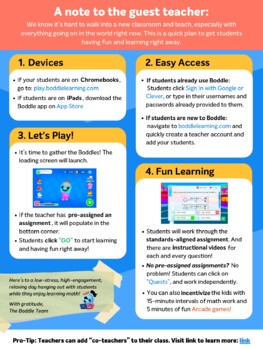
⭐ NO PREP K-6 FREE Emergency Sub Plans
⭐ Educators, we know it's tough right now, and there are days when you have to be out of the classroom due to illness or to take care of your own family. Preparing plans for a guest teacher can be time-consuming and challenging, especially if you need to be at home quickly and without much notice. ⭐ These sub-plans are meant to require no preparation on your part. They can be linked in your overall sub plans, printed out to keep handy when needed, posted in your Google Classroom, or shared wit
Grades:
PreK - 6th
Types:
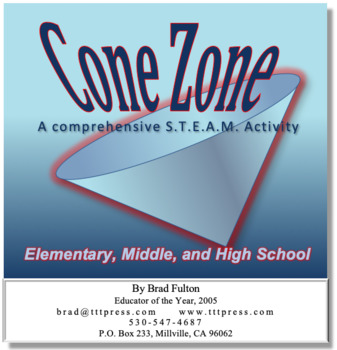
Cone Zone: A Comprehensive S.T.E.A.M. Activity
Students will design a cone-shaped descent chute for a planetary landing craft to optimize stability and minimize speed in this engaging lesson. This activity lends itself to student scientists of many ages. Young learners will benefit from simply creating the cones and testing their effectiveness. Older students can use spreadsheets that they create to analyze the data on a much more sophisticated level.
Grades:
5th - 9th
Types:
CCSS:
NGSS:
MS-ETS1-2
, 3-5-ETS1-3
, MS-ETS1-4
, 3-5-ETS1-2
, MS-ETS1-3
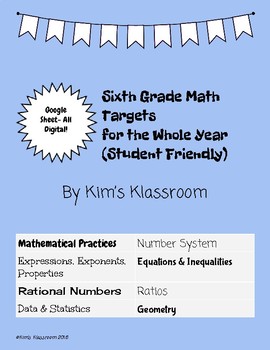
6th Grade Math Targets for Students (whole year)
This pdf includes screenshots of all units for CCSS Math standards for 6th grade. The screenshots are from the actual Google Spreadsheet that you will get a copy of. You will then share a copy with each student. Fully editable if needed.
Students keep track of their own level of learning on a scale of 1-5. In my classroom, if you convert this to a Google Sheet and have each student make their own copy it will automatically include conditional formatting. I use conditional formatting so student
Grades:
6th
Types:
SPSS software Secondary Data Analysis Workshop (Introductory/AP Statistics)
This handout is intended for those interested in teaching/learning basic introductory statistics concepts to analyze real data. Students will learn how to tell a story using secondary data analysis. The handout is for SPSS and the US Longitudinal Study of Adolescent Health data set. For handouts on the data set code book and raw data file, a PowerPoint to accompany the handout, or questions please email kristin.flaming@gmail.com or ldierker@wesleyan.edu.This handout was developed as a condensed
Subjects:
Grades:
6th - 12th, Higher Education, Adult Education
Types:
Translation Code
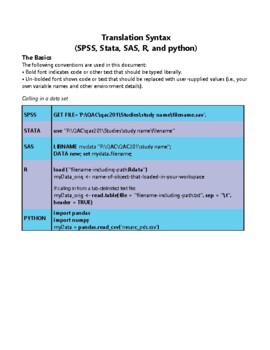
As part of our NSF-funded passion-driven statistics project, we have just started to share more widely our “translation code” aimed at supporting folks in learning code-based software and in moving more easily between them. The pdf includes all of the basic syntax for managing, displaying and analyzing data, translated across SAS, R, Python, Stata and SPSS. http://bit.ly/PDSTranslationCode.For more information about our warm and welcoming data-driven curriculum, check out https://passiondrivenst
Grades:
6th - 12th, Higher Education, Adult Education
Types:
STATA software Secondary Data Analysis
This handout is intended for those interested in teaching/learning basic introductory statistics concepts to analyze real data. Students will learn how to tell a story using secondary data analysis. The handout is for STATA software and the US Longitudinal Study of Adolescent Health data set. For handouts on setting up an account, the data set code book and raw data file, a PowerPoint to accompany the handout, or questions please email kristin.flaming@gmail.com or ldierker@wesleyan.edu.This
Grades:
6th - 12th, Higher Education, Adult Education
Types:
SAS software Secondary Data Analysis Workshop (Introductory/AP Statistics)
This handout is intended for those interested in teaching/learning basic introductory statistics concepts to analyze real data. Students will learn how to tell a story using secondary data analysis. The handout is for SAS (email for R, SPSS, Stata, & Python), a free cloud based system and the US Longitudinal Study of Adolescent Health data set. For handouts on setting up a free SAS account, the data set code book and raw data file, a PowerPoint to accompany the handout, or questions please e
Grades:
6th - 12th, Higher Education, Adult Education
Types:
R software Secondary Data Analysis Workshop (Introductory/AP Statistics)
This handout is intended for those interested in teaching/learning basic introductory statistics concepts to analyze real data. Students will learn how to tell a story using secondary data analysis. The handout is for R or R Studio, a free cloud based system and the US Longitudinal Study of Adolescent Health data set. For handouts on setting up a free R account, the data set code book and raw data file, a PowerPoint to accompany the handout, or questions please email kristin.flaming@gmail.com or
Subjects:
Grades:
6th - 12th, Higher Education, Adult Education
Types:
Showing 1-10 of 10 results

