AP Statistics Curriculum Review / Daily Warmups
- Zip
Description
Introducing the Ultimate AP Statistics Resource!
Unlock the potential of your AP Statistics students with a meticulously crafted resource, designed to engage and challenge them while aligning perfectly with the AP Statistics curriculum. Created by a seasoned teacher who achieved a remarkable 80% success rate in guiding students to earn 5's on the AP Statistics exam, this resource is a game-changer for any AP Statistics classroom.
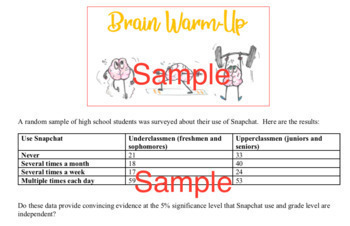
What sets this resource apart? It's the infusion of current culture references, including TV, sports, technology, and more, into original free response questions. Imagine the excitement in your classroom as students encounter familiar topics intertwined with their everyday interests. This innovative approach brings relevance and real-world connections to statistical concepts, enhancing student comprehension and engagement.
Not only does this resource numerous topics from the AP Statistics curriculum, but it also offers versatile applications to meet your teaching needs. Use it as a comprehensive AP exam review resource, providing students with invaluable practice and preparation. Additionally, integrate it seamlessly into your daily routine as brain warmups, homework checks, exit passes, or daily homework assignments. The choice is yours!
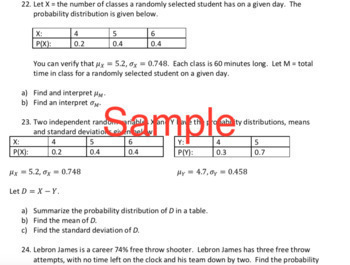
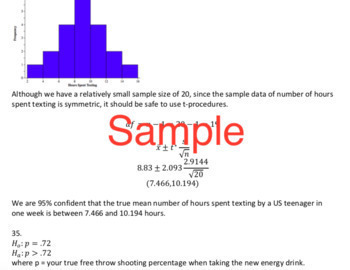
With two formats available - a comprehensive review and daily warmups - you have the flexibility to tailor your instruction to different classroom settings and teaching styles. Each question is accompanied by complete solutions, ensuring both you and your students have the support needed to excel.
Navigating through the resource is effortless, thanks to the included directory of topics listed by questions. You'll have a comprehensive overview of the content covered, allowing for easy integration into your lesson plans. To further captivate your students, we've even included original brain warmup artwork, creating an immersive and visually appealing learning experience.
Explore a wide range of topics within the AP Statistics curriculum, including analysis of quantitative and categorical data, interpretation and graphical displays of univariate and bivariate data, survey design, experimental design, probability, discrete and continuous random variables, binomial distribution, the normal distribution, sampling distributions, confidence intervals, significance tests, and linear regression inference and transformations. These are just a snapshot of the vast array of subtopics covered.
Take your AP Statistics teaching to new heights with this resource. Engage your students, empower their understanding, and propel them towards success on the AP Statistics exam. Don't miss out on this opportunity to unleash the potential of your students.


