184 results
High school graphing worksheets for Easel Activities
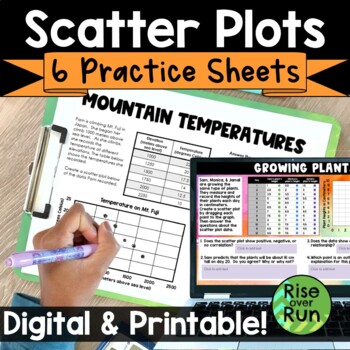
Scatter Plots & Line of Best Fit Practice Worksheets
Practice using scatterplots with these six activities. They can be used as bell ringers, exit tickets, homework, or just general practice. Students graph points, interpret data, and look for types of correlation with these practice sheets. All practice sheets are included as printable PDFs and interactive Google Slides. 6 scatter plot activities are included:Test Grades Scatter Plot PracticeMountain Temperatures Scatter Plot PracticeGrowing Plants Scatter Plot PracticeHair Length Data Collectio
Grades:
8th - 9th
Types:
CCSS:
Also included in: 8th Grade Math Activities & Lessons Bundle for the Whole Year

Writing Linear Equations in Slope Intercept Form Task Card Activity
Printable PDF, Digital & Easel by TPT Versions are included in this distance learning ready activity which consists of 10 Task Cards (with & without QR Codes) to help strengthen students’ skills in writing a linear equation in Slope Intercept form from a graph.Distance learning?No problem! This activity now includes Google Slides & Easel by TPT digital options!Explore the ⌨ Distance Learning in my store for more digital resourcesThree Forms of Use IncludedPrintable PDFGoogle SlidesEa
Grades:
7th - 9th
Types:
Also included in: 8th Grade Math Bundle ~ All My 8th Grade Math Products at 1 Low Price
Domain and Range of Functions Worksheet
Hey there, Math Teachers! Empower your students to master domain and range identification with our comprehensive worksheet! Our two-sided PDF worksheet includes 32 thought-provoking questions that cover identifying the domain and range of relationships given as ordered pairs, graphs, or tables.Using the vertical line test, students will learn to identify functions and define them as a relationship between x and y that assigns exactly one output for every input. Our easy-to-use answer key ensures
Grades:
8th - 9th
Types:
CCSS:
Also included in: Relations and Functions Introduction Worksheets Bundle
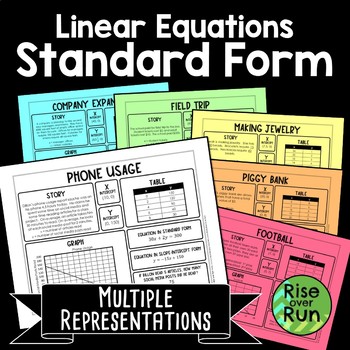
Graphing Linear Equations in Standard Form Real World Tasks
Help your students make sense of linear functions in standard form with these practice sheets. Students will see how equations, graphs, tables, and word problems all connect! 6 tasks are provided where students fill in missing information. They complete:a storya graphinterceptsa tablean equation in standard forman equation in slope-intercept formand answer a question about the scenarioEach of the 6 sheets provides just enough information so students can figure out the rest! A blank template i
Grades:
8th - 9th
Types:
CCSS:
Also included in: 8th Grade Math Activities & Lessons Bundle for the Whole Year
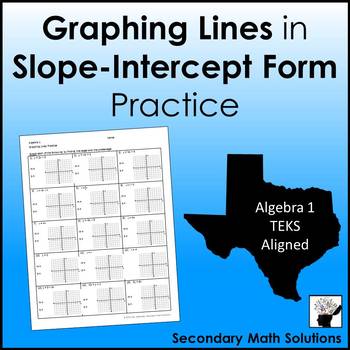
Graphing Lines in Slope-Intercept Form Practice
This is a one-sided practice page on graphing lines in slope-intercept form. There are 15 practice problems designed for the beginning grapher. Almost all of the equations are in y = mx + b format. The student first identifies m and b from the equation then uses them to graph. The two special cases are included and only a few equations need some "adjustment" such as 3y = 6x. Key included.Also available:Graphing Lines in Slope-Intercept Form NotesGraphing Lines Partner Activity Task Cards© 2015 S
Subjects:
Grades:
8th - 11th
Types:
Also included in: Linear Functions Unit Bundle - Algebra 1 Curriculum
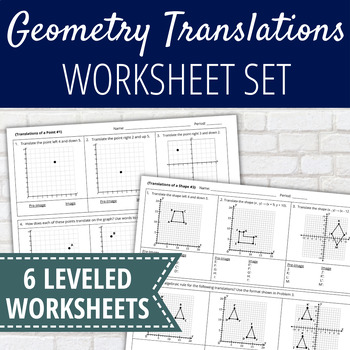
Scaffolded Geometry Translations Worksheet
Looking for a differentiated geometry translations worksheet set? This scaffolded worksheet set will help student dive deep into understanding rather than mimicry.⭐This resource includes⭐Lesson plan instructionsScaffolded Translation Worksheets (Includes 6)Answer Keys✨How This Set Works✨Within the 6 worksheets, there are 2 sections:Translation of a PointTranslation of a ShapeEach worksheet serves a unique purpose. Worksheet 1 & 4 do not use algebraic notation. This is perfect for students wo
Grades:
8th - 9th
Also included in: Scaffolded Geometric Transformations Unit and Activities
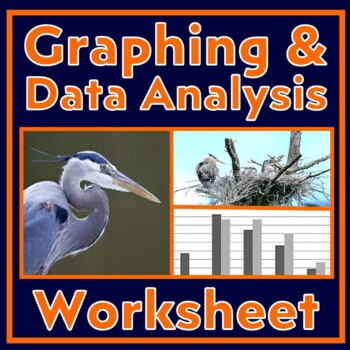
Data Analysis and Graphing Worksheet Scientific Method Practice (Herons)
Students build GRAPHING and DATA ANALYSIS skills. This activity provides a data table and an incomplete bar graph related to nesting habits of herons. Students follow directions that lead them through foundational graphing and data analysis skills. Instruction is built into the worksheet. This activity builds the following skills:Setting up bar graphs, including choosing intervals, labeling axes, and writing graph titles.Using data to make a bar graph (with an example already in place).Pulling
Subjects:
Grades:
6th - 9th
CCSS:
NGSS:
MS-LS2-2
, MS-LS2-1
, HS-LS2-1
, HS-LS2-2
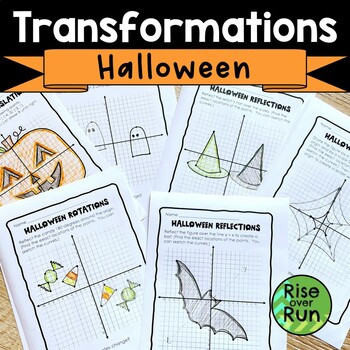
Halloween Transformations Practice | Translate, Reflect, Rotate, Dilate Figures
Engage students as they practice translations, reflections, rotations, and dilations on a coordinate plane with these fun Halloween activity sheets! Included are 8 half sheets that challenge students to complete transformations in order to create a Halloween image. Here's what is included:2 practice exercises for translating2 practice exercises for reflecting2 practice exercises for rotating2 practice exercises for dilating Answer KeysEach practice has a follow up question asking students to thi
Grades:
8th - 10th
Types:
CCSS:

Distance Formula Worksheet - Maze Activity
Printable PDF, Google Slides & Easel by TPT Versions are included in this distance learning ready activity which consists of a maze where students will have to calculate the distance between two given points using the distance formula.Distance learning?No problem! This activity now includes Google Slides & Easel by TPT digital options!Explore the ⌨ Distance Learning in my store for more digital resourcesThree Forms of Use IncludedPrintable PDFGoogle SlidesEasel by TPTImportant Informatio
Grades:
7th - 10th
Types:
CCSS:
Also included in: Geometry Bundle ~ All My Geometry Products at 1 Low Price
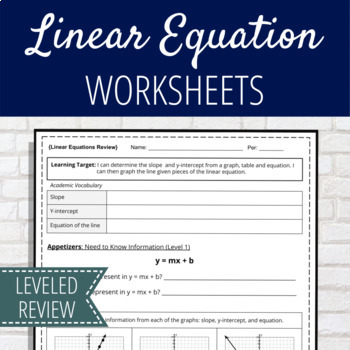
Linear Equations in Slope Intercept Form Review Worksheets
Are you looking for a linear equations in slope intercept form review? Miss Kuiper's Classroom has you covered! This is a leveled worksheet set to meet every student where they are at when it comes to slope. It includes finding slope from an equation, a graph, two points, and a table. It also has problems about y-intercepts and creating an equation from a coordinate pair and the y-intercept. Read how I use this review activity here!Practice problems are divided into 4 levels:Level 1Academic voca
Grades:
8th - 10th
CCSS:
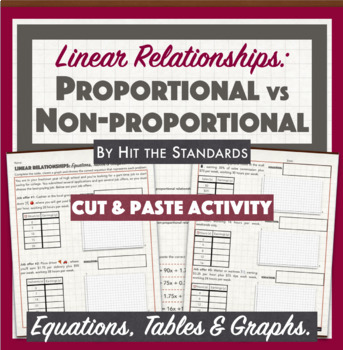
Proportional & Non-proportional Linear Relationships: Equations Tables Graphs
In this cut&paste activity, students must choose the best-paying job out of 5 given options. Each job salary represents a linear relationship, so students must complete a table, create a graph that represents each of them. Also, they must choose the correct equation (cut & paste) that represents each linear relationship. Finally, students must identify the relations as proportional or non-proportional. Hits CC Standards 7.RP.A.2, 8.EE.B.5, 8.F.B.4 & 8.F.B.5 Hits TEKS 8.4B, 8.5A, 8.5
Subjects:
Grades:
7th - 9th
Types:
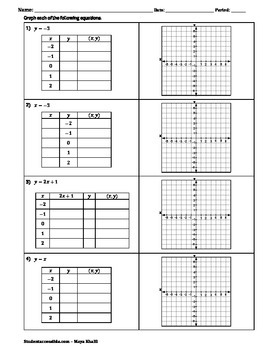
Graphing Linear and Nonlinear Equations with Tables of Values Worksheet
Two pages of graphing linear and nonlinear equations using tables of values. Some of these could be graphed with the slope and y-intercept. The equations are:y = -3 x = -3y = 2x +1 y = x y = x-squaredy = x-cubed y = |x| y = sqrt(x). The answer key is on pages 3 and 4.Make sure the printer does not shrink this resource. The preview above shows the answer key.
Grades:
7th - 10th
Types:
CCSS:

Midpoint Formula Worksheet - Maze Activity
Printable PDF, Google Slides & Easel by TPT Versions are included in this distance learning ready activity which consists of a maze where students will have to calculate the midpoint between two given points using the midpoint formula.Not all boxes are used in the maze to prevent students from just figuring out the correct route. Students will have to successfully calculate the midpoint 16 times to complete the maze. Distance learning?No problem! This activity now includes Google Slides &
Grades:
8th - 10th
Types:
Also included in: Geometry Bundle ~ All My Geometry Products at 1 Low Price

Graphing and Analyzing Data Activity with Scientific Method (Woodpeckers)
Use this data analysis and graphing worksheet to build GRAPHING and DATA ANALYSIS skills. This worksheet provides a data table from an experiment designed to find out which food woodpeckers prefer. Students follow directions that lead them through foundational graphing and data analysis skills, including making a bar graph and then analyzing it. Instruction is built into the worksheet. Students will practice the following skills in this activity:Setting up bar graphs, including choosing inter
Subjects:
Grades:
7th - 10th
CCSS:
NGSS:
MS-LS2-2
, MS-LS2-4
, HS-LS2-2

FORTMATH - Distance Between Two Points on a Coordinate Plane
In Fortnite - Distance Between Two Points on a Coordinate Plane activity students will use the distance formula to calculate the lengths of the lines between the given Fortnite location points on the map. There are 10 problems in total! Perfect practice for your students using the distance formula with this trendy video game theme!Hits Common Core Standards 6.NS.C.6c, 6.NS.C.8, 8.G.B.8, HSG-GPE.B.7, and TEKS 8.7D.
Grades:
7th - 12th
Types:
CCSS:

Vertex Form (of a Quadratic) Notes & Practice
This is a double-sided notes page on Vertex Form of Quadratic Functions. TEKS Aligned: A6BThe notes begin with the vertex form equation and defining (h, k), (x, y) and "a". Next, four examples are provided where the student is given a quadratic function in vertex notation and has to identify the vertex and whether the parabola opens up or down. Then, they sketch a graph of the quadratic.Next, steps and a worked example are provided to show the student how to write the equation of a quadratic in
Subjects:
Grades:
8th - 12th
Also included in: Quadratic Functions Unit Bundle - Algebra 1 Curriculum
Writing the Equations of a Line Worksheet using Point Slope Form
Attention Math Teachers! Our Point-Slope Form Worksheet is the perfect resource to help your students master the equation of a line in point-slope form. Our two-sided worksheet includes step-by-step scaffolding, starting with finding the slope using the slope formula and progressing to writing equations using point-slope form.Our worksheet is appropriate for Algebra 1 classes and more advanced Pre-Algebra classes and can be used as a classwork or homework activity. We also include practice writi
Grades:
9th
Types:
CCSS:
Also included in: Finding Slope Worksheets Bundle
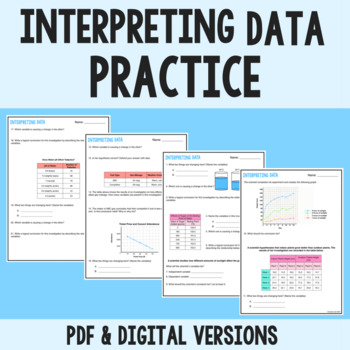
Interpreting Data Practice
Do your students struggle with finding meaning behind the data they’re collecting? Are many of your students still struggling with independent and dependent variables? If you answered yes to either of those questions, then this resource is for you! Skills covered in this resource include:Identifying variables in graphs and data tablesDetermining the relationship between variables Who is this resource for?This resource can be used by classroom teachers, tutors, and parents of students in grades 6
Subjects:
Grades:
6th - 9th
Types:
Also included in: Science & Scientific Method - FULL UNIT
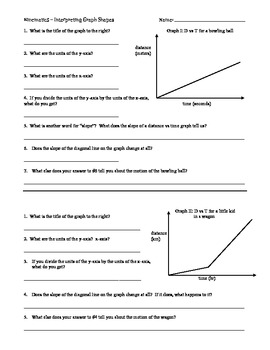
Graphing - Interpreting Distance vs Time Graphs
This worksheet gives students 4 distance vs time graphs and a series of questions about each to lead them through reading graphs. The main goal is to hammer home the point that slope = velocity.This is the second in my set of worksheets on graphing that will lead students through the basics of constructing graphs, interpreting the meaning of graphs, and calculating quantities from graphs.This is ideal for physical science classes where the students are in pre-algebra or algebra 1.
Subjects:
Grades:
7th - 9th, Adult Education
Types:
Also included in: Graphing Bundle
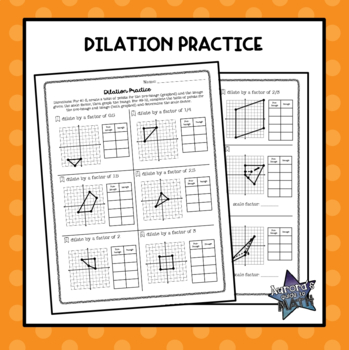
Dilation Practice
Dilation PracticeThis no-prep resource is a great way to get students to practice skills related to a geometric dilation! This resource contains a two-page practice activity containing 12 problems. For eight problems, students will perform a dilation given a graph of the original figure and a scale factor. For the last four problems, students are given a graph of the pre-image and image for a figure, and asked to determine the scale factor for the dilation that occurred. This is a great way for
Grades:
6th - 12th
Types:
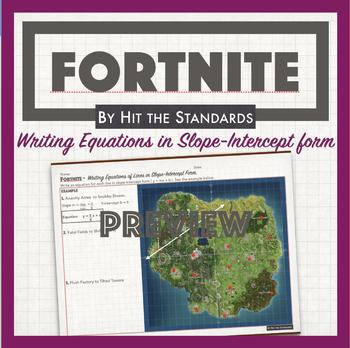
FORTMATH - Writing Equations of Lines in Slope-Intercept Form Math Game Activity
Keep your students engaged and learning with this Fortnite - Writing Equations of Lines in Slope-Intercept Form, which consists of writing an equation for each line formed by two different Fortnite location points in slope-intercept form ( y = mx + b ). One example is provided. Just print & Go!Hits Common Core Standards 8.EE.B.5, and TEKS 8.4C and A.2B.Assess the quality of my work with this free resource!✔ Excellent for class or homework! ✔ Just print and go! ✔ Answer key included!☀ Do you
Subjects:
Grades:
7th - 12th
Types:
CCSS:
Also included in: Rate of Change or Slope & Y-intercept Math UNIT 4 BUNDLE! 30% OFF
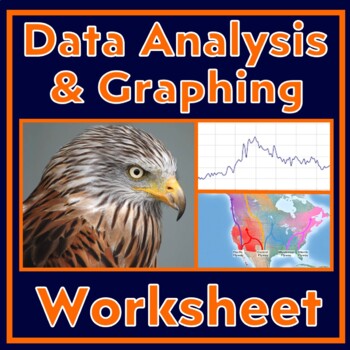
Scientific Method Worksheet Graphing and Data Analysis Practice (Falcons)
Use this data analysis and graphing worksheet to build GRAPHING and DATA ANALYSIS skills. This worksheet provides a data table about the distances that falcons travel. Students follow directions that lead them through graphing and data analysis skills, including making a line graph and then analyzing it.Instruction is built into the worksheet.Students will practice the following skills in this activity:Setting up line graphs, including choosing intervals, labeling axes, and writing graph titles.
Subjects:
Grades:
6th - 9th
CCSS:
NGSS:
MS-LS2-2
, MS-LS2-1
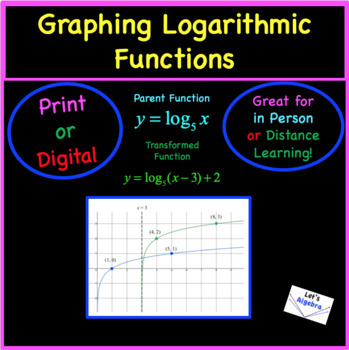
Logarithms: Graphing and Transforming
Graphing and Transforming Logarithmic Functions: Great for Distance Learning or in Person Learning!This product covers the concepts of graphing and transforming logarithmic functions. In the lesson students will graph logarithmic functions by converting them into exponential functions. They will then fill in a table "backwards" to help them graph the functions. Students will then observe that when graphing, if logarithmic functions are in the "proper" form, the x-intercept is always 1, and the p
Subjects:
Grades:
10th - 12th
Types:
CCSS:
Also included in: Logarithms Mini Bundle
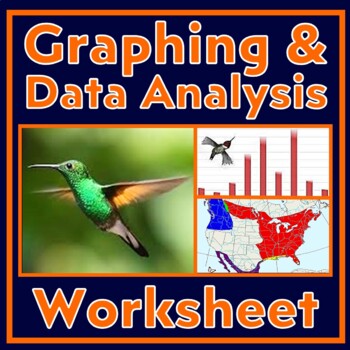
Scientific Method Worksheet Graphing and Analyzing Data Activity (Hummingbirds)
Build GRAPHING and DATA ANALYSIS skills! This worksheet provides a data table related to hummingbird migration. Students follow directions that lead them through graphing the data and analyzing it. Students will practice the following skills in this activity:Setting up bar graphs, including choosing intervals, labeling axes, and writing graph titles.Generating a bar graph from provided data.Pulling data from their graph.Data analysis that requires using data as evidence to support conclusions.R
Grades:
7th - 10th
CCSS:
NGSS:
MS-LS2-4
, MS-LS2-1
, HS-LS2-1
, HS-LS2-2
Showing 1-24 of 184 results


