Graphing Linear and Nonlinear Equations with Tables of Values Worksheet
Maya Khalil
453 Followers
Resource Type
Standards
CCSS8.EE.B.5
CCSSHSF-IF.C.7a
CCSSHSF-IF.C.7b
Formats Included
- PDF
- Easel Activity
Pages
4 pages
Maya Khalil
453 Followers
Easel Activity Included
This resource includes a ready-to-use interactive activity students can complete on any device. Easel by TPT is free to use! Learn more.
Description
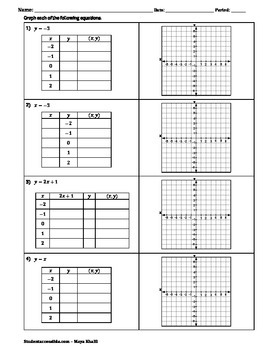
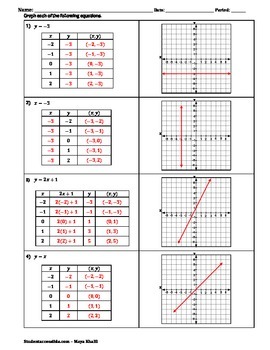
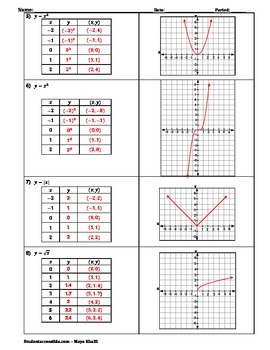
Two pages of graphing linear and nonlinear equations using tables of values. Some of these could be graphed with the slope and y-intercept.
The equations are:
y = -3
x = -3
y = 2x +1
y = x
y = x-squared
y = x-cubed
y = |x|
y = sqrt(x).
The answer key is on pages 3 and 4.
Make sure the printer does not shrink this resource. The preview above shows the answer key.
Total Pages
4 pages
Answer Key
Included
Teaching Duration
N/A
Last updated Sep 19th, 2015
Report this resource to TPT
Reported resources will be reviewed by our team. Report this resource to let us know if this resource violates TPT’s content guidelines.
Standards
to see state-specific standards (only available in the US).
CCSS8.EE.B.5
Graph proportional relationships, interpreting the unit rate as the slope of the graph. Compare two different proportional relationships represented in different ways. For example, compare a distance-time graph to a distance-time equation to determine which of two moving objects has greater speed.
CCSSHSF-IF.C.7a
Graph linear and quadratic functions and show intercepts, maxima, and minima.
CCSSHSF-IF.C.7b
Graph square root, cube root, and piecewise-defined functions, including step functions and absolute value functions.


