TPT
Total:
$0.00

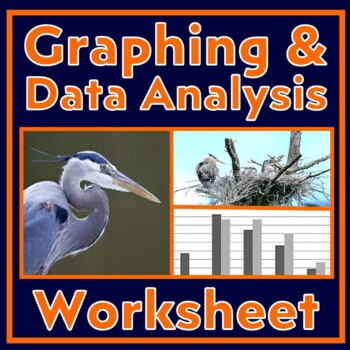
Data Analysis and Graphing Worksheet Scientific Method Practice (Herons)

Rated 4.92 out of 5, based on 13 reviews
4.9 (13 ratings)
;
Elevation Science
637 Followers
Grade Levels
6th - 9th
Standards
Formats Included
  • PDF
Pages
3 pages
$3.00
$3.00
Share this resource
Report this resource to TPT
Elevation Science
637 Followers
Easel Activity Included
This resource includes a ready-to-use interactive activity students can complete on any device.  Easel by TPT is free to use! Learn more.
Also included in
  1. Save 33% OFF list prices! Build GRAPHING and DATA ANLAYSIS skills with these scaffolded worksheets. Each worksheet builds upon the last to grow student independence with graphing and data analysis. Students will graph and analyze scientifically meaningful data based on real-world research on wild
    Price $9.99Original Price $15.00Save $5.01
  2. SAVE 25% OFF LIST PRICES! Build foundational SCIENCE SKILLS such as experiment design, graphing, and data analysis! This bundle includes 8 worksheets that give your students structured support to practice these skills. Use in a scientific method unit, throughout the school year to reinforce skill
    Price $17.99Original Price $24.00Save $6.01

Description

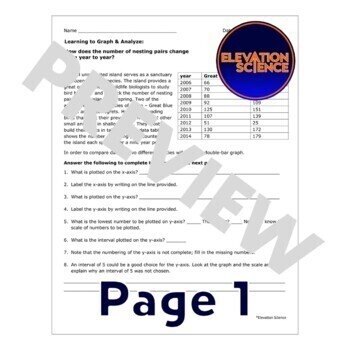
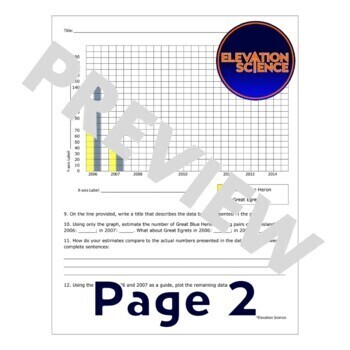
Students build GRAPHING and DATA ANALYSIS skills. This activity provides a data table and an incomplete bar graph related to nesting habits of herons. Students follow directions that lead them through foundational graphing and data analysis skills.

Instruction is built into the worksheet.

This activity builds the following skills:

  • Setting up bar graphs, including choosing intervals, labeling axes, and writing graph titles.
  • Using data to make a bar graph (with an example already in place).
  • Pulling data from the graph.
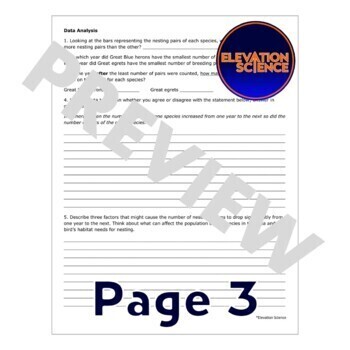
  • Data analysis that requires using data as evidence to support conclusions.

A Note On Scaffolding:

While this worksheet is a stand-alone lesson as-is, we use it in a series. Our Graphing & Data Analysis Bundle includes this worksheet plus 4 others. Each worksheet requires slightly more independent graphing skills than the last, providing a framework to build graphing skills. Read more about this set of activities HERE.

Teacher Notes:

Please consider clicking HERE to follow Elevation Science on TPT!

Total Pages
3 pages
Answer Key
Included
Teaching Duration
N/A
Report this resource to TPT
Reported resources will be reviewed by our team. Report this resource to let us know if this resource violates TPT’s content guidelines.

Standards

to see state-specific standards (only available in the US).
Cite specific textual evidence to support analysis of science and technical texts.
Determine the meaning of symbols, key terms, and other domain-specific words and phrases as they are used in a specific scientific or technical context relevant to grades 6–8 texts and topics.
Determine the central ideas or conclusions of a text; trace the text’s explanation or depiction of a complex process, phenomenon, or concept; provide an accurate summary of the text.
Determine the meaning of symbols, key terms, and other domain-specific words and phrases as they are used in a specific scientific or technical context relevant to grades 9–10 texts and topics.
Model with mathematics. Mathematically proficient students can apply the mathematics they know to solve problems arising in everyday life, society, and the workplace. In early grades, this might be as simple as writing an addition equation to describe a situation. In middle grades, a student might apply proportional reasoning to plan a school event or analyze a problem in the community. By high school, a student might use geometry to solve a design problem or use a function to describe how one quantity of interest depends on another. Mathematically proficient students who can apply what they know are comfortable making assumptions and approximations to simplify a complicated situation, realizing that these may need revision later. They are able to identify important quantities in a practical situation and map their relationships using such tools as diagrams, two-way tables, graphs, flowcharts and formulas. They can analyze those relationships mathematically to draw conclusions. They routinely interpret their mathematical results in the context of the situation and reflect on whether the results make sense, possibly improving the model if it has not served its purpose.

Reviews

Questions & Answers

637 Followers