
Scatter Plots & Line of Best Fit Practice Worksheets


- PDF
- Google Apps™
- Easel Activity

What educators are saying
Also included in
 If you enjoy teaching students using discovery learning and engaging activities with real world connections, this huge pack of resources is here to help you plan your entire year of 8th grade math.Lessons help you teach the standards, encourage discussions, and challenge students to think. StudentsPrice $225.00Original Price $386.46Save $161.46
 Do you love discovery learning, collaboration, hands-on activities, and projects that help students make sense of the math they are learning? This curriculum is packed with engaging and challenging Algebra I and 8th grade math resources for the whole year. A variety of activities, inquiry learningPrice $350.00Original Price $677.94Save $327.94
 This curriculum bundle includes a variety of activities, assessments, games, group activities, projects, inquiry lessons, guided notes, and more for teaching Algebra I CCSS standards. The activities are centered on discovery learning and engaging activities with real world connections. Lessons helpPrice $225.00Original Price $445.21Save $220.21
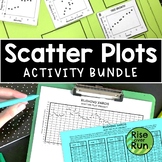 Engage students in learning about scatter plots with this bundle of activities! The activities and lessons include real world examples to help students see the relevance and importance of scatter plots!Included:Scatter Plot Experiment ActivityScatter Plot Practice Sheets (Six Worksheets)Math MeetsPrice $14.00Original Price $20.99Save $6.99
Description
Practice using scatterplots with these six activities. They can be used as bell ringers, exit tickets, homework, or just general practice. Students graph points, interpret data, and look for types of correlation with these practice sheets.
All practice sheets are included as printable PDFs and interactive Google Slides.
6 scatter plot activities are included:
- Test Grades Scatter Plot Practice
- Mountain Temperatures Scatter Plot Practice
- Growing Plants Scatter Plot Practice
- Hair Length Data Collection and Scatter Plot Activity
- Sports and Homework Data Collection and Scatter Plot Activity
- Blank Data Collection and Scatter Plot Template
The first three sheets provide a table of data for students to plot on a scatter plot and then answer questions. The next two sheets provide topics for students to collect data from their classmates and then create a scatter plot. The last sheet is a blank template for collecting data and creating a scatter plot.
Important vocabulary terms included in the work:
Correlation, line of best fit, outlier
Answer Keys for first three scatter plot practice sheets are included. The others ask students to survey classmates to complete, so the answers will vary.
Common Core Standards:
CCSS.Math.Content.8.SP.A.1
Construct and interpret scatter plots for bivariate measurement data to investigate patterns of association between two quantities. Describe patterns such as clustering, outliers, positive or negative association, linear association, and nonlinear association.
CCSS.Math.Content.8.SP.A.2
Know that straight lines are widely used to model relationships between two quantitative variables. For scatter plots that suggest a linear association, informally fit a straight line, and informally assess the model fit by judging the closeness of the data points to the line.
CCSS.Math.Content.HSS.ID.B.6
Represent data on two quantitative variables on a scatter plot, and describe how the variables are related.
