764 results
High school graphing worksheet microsofts
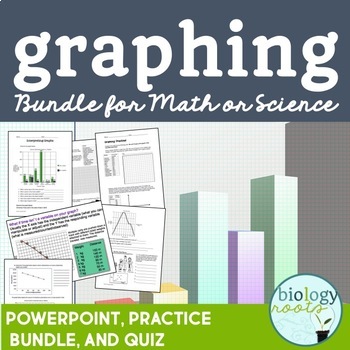
Graphing Bundle for Secondary
Complete and editable graphing bundle includes plenty of practice, editable PowerPoint notes to introduce or reinforce graphing concepts, as well as an assessment to finish it off! Suitable for grades 7 and up. Included in the package is:1. How to Interpret Graphs PowerPoint PresentationCovers line graphs, bar graphs, scatter plots and pie charts. Answers included on teacher version.Student notes included (PDF and PPT). 2. Interpreting Graphs- 3 pages of graph interpretation in which students an
Subjects:
Grades:
6th - 10th
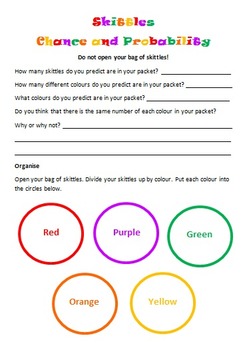
Skittles Chance and Probability (Editable)
Chance and Probability activity using yummy Skittles!!!
Students are to predict the colours and quantities before they open the skittles bag. Students are to complete a chance experiment where they use a tally to collect their data. Students then transfer their data in fractions, decimals and percentages. Students are to create a bar graph using their data as well as answer chance and probability questions about the data. I used this with my grade 5/6 students and they loved it!
Subjects:
Grades:
3rd - 10th
Types:
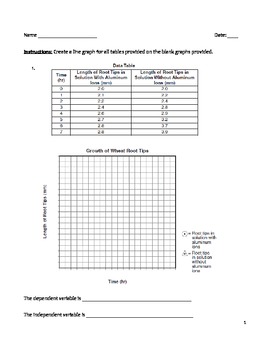
High School Science Graphing Worksheet - Making Line Graphs in Science
Use this worksheet to help your students practice making line graphs. In addition, they will have to identify both the independent and dependent variables. Hopefully, they will make the connection between the variables and their placement on the graph. There is a key provided for the teacher. There are ten line graphs for students to work with.
line graph, plot points, independent variable, dependent variable, data table, uniform scale, x-axis, y-axis
Subjects:
Grades:
8th - 12th
Types:
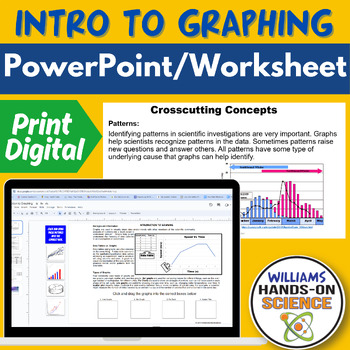
NGSS Intro to Graphing Crosscutting Concepts Science & Engineering Practices
If you are teaching your students how to understand graphs and want to hit NGSS Science and Engineering Practices and Crosscutting Concepts, this resource is a great scaffold or lecture! This resource is great as a warm up/bell ringer, lecture, homework or sub plan.This resource includes the following:-Student Handout-Key-Editable PowerPoint for lecture and/or scaffold This resource includes the following Concepts:-Interpreting Graphs-How to make a graph-Difference between data tables and graph
Subjects:
Grades:
6th - 12th
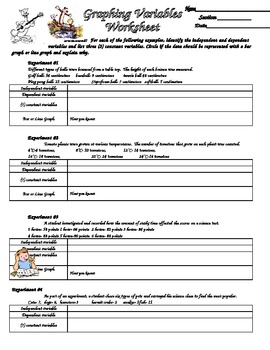
Scientific Method Variables and Graphing Practice
Students are given six different sets of experimental data and asked to identify the variables (independent, dependent etc.). They also reinforce graphing by identifying if the data should be represented with a bar or line graph. With this information, students the create data tables and graphs for the data.
Subjects:
Grades:
3rd - 12th
Types:
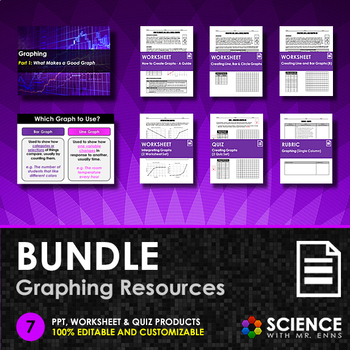
Graphing Skills or Making Graphs Unit Bundle on Line, Bar, and Circle Graphs
This bundle contains 7 graphing resources that forms a suite of products designed to teach graphing skills to middle school and early high school students.Graphing Skills Addressed:Identifying when to use a line, bar, or circle graph based on dataCreating line graphsCreating bar graphsCreating circle graphsDrawing lines of best fitInterpreting graphs (positive, negative, and no correlation)Bundle Contents:PPT - Graphing Skills (WITH SUMMARY NOTES)Worksheet - How to Create Line, Bar and Circle Gr
Subjects:
Grades:
7th - 9th
CCSS:
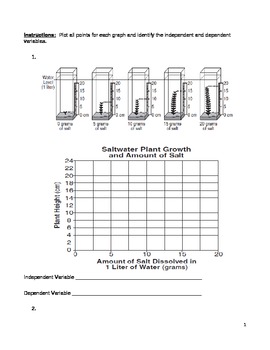
Middle School Math and Science Graphing Practice - Middle School Line Graphs
Use this resource to help your middle school math and science students learn and practice how to make line graphs as well as identify the independent and dependent variables. Move beyond bar graphs! There is a teacher key provided and eight graphs for practice.
line graph, plot points, x-axis, y-axis, independent variable, dependent variable
Subjects:
Grades:
5th - 9th
Types:
Speed Velocity Acceleration and Graphing Worksheets
Check out these hassle-free self-paced exercises on Speed, Distance, Time, Acceleration, and Graphing! This ready-to-use resource requires no preparation, offering students engaging problems to solve independently. Enhance the learning experience with an accompanying PowerPoint presentation that guides students through the worksheets effortlessly. Plus, enjoy the added convenience of Spanish versions for both the worksheets and PowerPoint. Elevate your classroom experience with this comprehensiv
Subjects:
Grades:
8th - 10th
NGSS:
MS-PS2-2
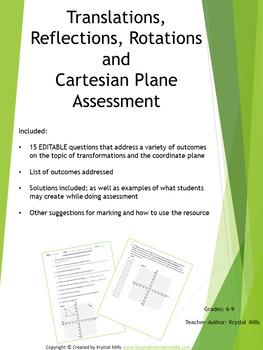
Translation, Reflection, Rotation and Cartesian Plane Test
This Translation, Reflection, Rotation, and Cartesian Plane Test can be used as a quiz, test, assignment, or formative assessment to assess your students' understanding of the Cartesian plane and Transformations. How you use this editable document (WORD file) will depend on your grade level, outcomes, learning goals, and students. Various outcomes are addressed including:-label the x and y axes and origin of a Cartesian plane-identify points on a Cartesian plane -plot points on a Cartesian plane
Subjects:
Grades:
6th - 9th
Types:
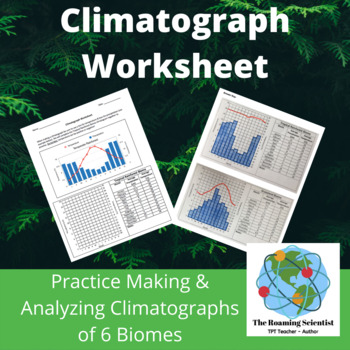
Printable Climatograph Worksheet
This comparative biome graphing worksheet asks students to create and analyze six climatographs for six of Earth’s major terrestrial biomes. Help your students develop graphing skills including drawing bar graphs, line graphs, dual y-axis graphs and interpreting data.This climatograph activity can be used as a lesson, homework assignment, it can be used in small groups or individually or as a revision activity. This is also an excellent substitute teacher lesson. This activity is easily modifiab
Subjects:
Grades:
6th - 12th
Types:
Making Science Charts and Graphs
A simplified look at making charts and organizing data in science.
-Data Charts
-Circle Graphs
-Bar Graphs
-Line Graphs
-Key Vocabulary List
-Quiz/Assessment
-Activity - Practice
-Teacher answer key for quiz and activity
Thanks for taking the time to stop by my store!
Mrs. Degs
Teaching Science Well
Blog: http://teachingsciencewell.wordpress.com/
Facebook: https://www.facebook.com/TeachingScienceWell
TPT: http://www.teacherspayteachers.com/Store/Teaching-Science-Well-Science-Resources
Pi
Subjects:
Grades:
3rd - 10th
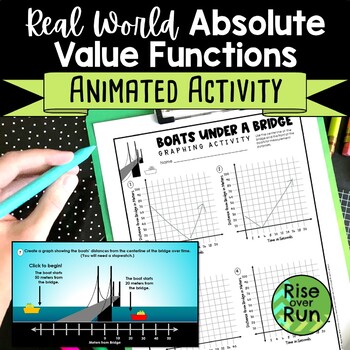
Real World Absolute Value Functions Activity
Challenge students to use absolute value graphs and equations for modeling real world situations! In the animated PowerPoint provided, students watch boats move across the screen and under a bridge. Using a stopwatch (or their phones), they time the movements. They create a graph showing each boat’s distance from the bridge. Then they determine each function and x-intercept (or when the boat passes under the bridge). 8 animations are provided. They begin simple but progress in difficulty. This
Subjects:
Grades:
9th - 12th
CCSS:
Also included in: Algebra 1 and 8th Grade Math Curriculum Bundle for Entire Year
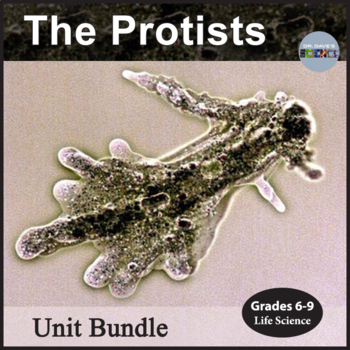
Protists Unit Bundle Protista Kingdom
This unit bundle contains both a 75-slide Protist PowerPoint as well as 19-page activity packet for the Protists. You receive a 20% discount on both resources when you purchase this bundle. Please click on the individual resources for more information. Terms of UseCopyright © Dr. Dave's Science. All rights reserved by author. This product is strictly for individual use and may not be copied or given to other teachers. Copying any part of this product and placing it on the Internet in any form (
Grades:
6th - 9th
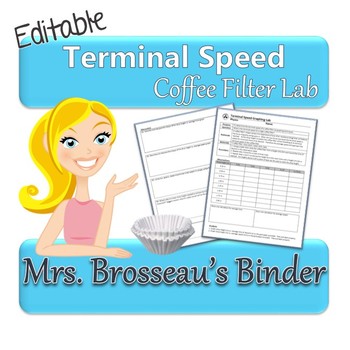
Terminal Speed Physics Lab & Graphing Activity using Coffee Filters {EDITABLE}
Do you want a teach your students about terminal speed, but can't find the time to put together a complex lab and then mark it all?
This is the lab for you!
This is part of my cost-saving, amazing Physics Bundle!
This is a quick lab that your students can complete start to finish in one class period. The student handout pages include:
• Purpose
• Question
• Rationale
• Materials
• Procedure
• Observation Table
• Graphing and Follow-up Questions + Conclusion
You'll need:
• meter stick
• coff
Grades:
7th - 12th
Types:
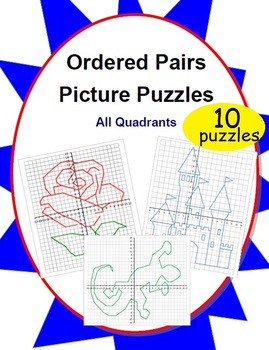
10 Ordered Pairs Mystery Picture Puzzles (All Quadrants)
10 original pictures perfect for any order pair puzzler. Start simple with a continuous connect-the-dot picture and graduate to more complex pictures composed of multiple sections. The built-in self-checking nature of creating a picture makes it easy for students to immediately assess their own progress.This 15-page PDF file includes:- 10 reproduction-ready original picture puzzles- An illustrated key so teachers can select appropriate puzzles based on student skill level and intended use- Numbe
Grades:
4th - 10th
Types:
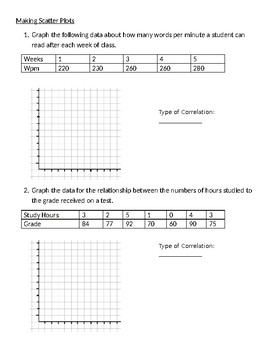
Making Scatter Plots Worksheet
2 pages of practice problems with given information to create scatter plots
Grades:
5th - 12th
Types:
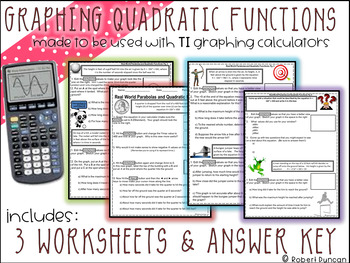
Graphing Quadratic Functions Worksheet for TI Calculators
This is sort of an exploration type activity to help students become more familiar with the window and trace functions of TI calculators. The questions are all application type problems and my goal was to create a worksheet that would let students go at their own pace without me giving direct instruction that was either too fast or too slow for them.
File includes: 4 worksheets to be used with TI Graphing Calculator and detailed answer key.
I found that letting students work with a partner
Subjects:
Grades:
8th - 12th
Types:
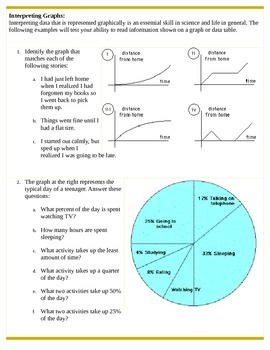
Interpreting Graphs Review Worksheet
This worksheet allows you test student's ability to read and interpret data presented on various types of graphs and data tables. Students must be able to read scientific notation to complete this worksheet.
The worksheet may be given as an assessment. It may also be split into several smaller warm-up activities and given over several days.
Subjects:
Grades:
9th - 12th
Types:
Bundle: Super Speed Power Pack
This bundle is a $35.00 value, but has been marked down by 20%! A great deal, so don't miss out!This digital package contains everything that I have personally made and incorporate into the current science curriculum about Speed, Velocity, Acceleration, Distance, and Displacement. (It mostly involves activities and worksheets involving the calculation and graphing of speed.)The Speed, Velocity, and Acceleration Power Point is a total of 27 slides, the Speed Problem PowerPoint totals at 63 slides
Grades:
6th - 9th
Bundle Ecuación Lineal
Ecuación Lineal El recurso trabaja los siguientes temas:Primera Parte•Definición de ecuación lineal•Identificar si una ecuación es lineal•Identificar si un par ordenado es solución•Explicación de la ecuación pendiente-intercepto y=mx+b•Definición de la pendiente y tipos•Definición del intercepto en y•Graficar utilizando tabla de valores•AplicacionesSegunda Parte•Definición de ecuación lineal, pendiente e intercepto en y (repaso)•Explicación de la ecuación pendiente-intercepto y=mx+b (repaso)•Hal
Grades:
7th - 9th
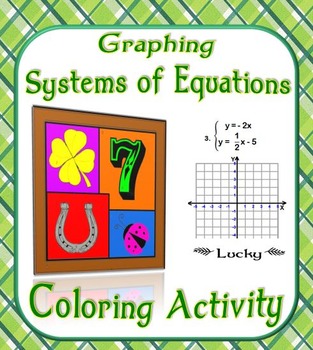
Graphing Systems of Equations Coloring Activity
This is a set of 9 systems problems that asks students to graph in both standard and slope-intercept form to find x and y. The set contains large coordinate graphs to help students graph more accurately. Students solve the problem, find the answer in the picture, and color it based upon a given table of colors.
Graphing Systems of Equations Coloring Activity by Suzie's Angle is licensed under a Creative Commons Attribution-NonCommercial-NoDerivatives 4.0 International License
Grades:
8th - 11th
Types:
CCSS:
ACT ASPIRE - Test Prep - Practice - Reading Graphs/Data Interpretation Exemplar
Students will read a short passage and use different types of tables and graphs to answer questions. A great resource for AMI day. Distance Learning. Keywords- ACT, ACT ASPIRE, SCIENCE, GRAPHS, ACT Aspire like questions, Test Prep
Subjects:
Grades:
3rd - 9th
Types:
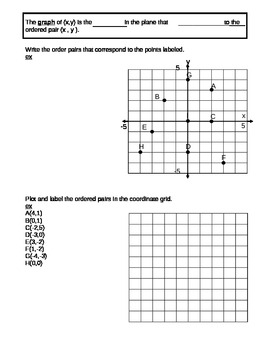
Coordinate Plane
This is a document that is used for guided notes for the Coordinate Plane. The notes practices how to plot points given ordered pairs, how to write the ordered pairs given the graph,and numbering the 4 quadrants.
Grades:
5th - 10th
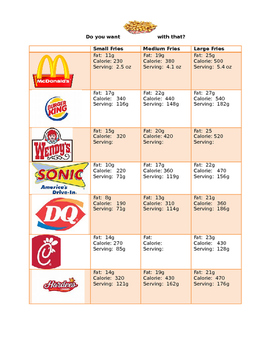
French Fry Scatter Plot & Best Line of Fit
Students will compare the nutritional values and serving sizes of french fries from various fast food restaurants. Based on this information, they will create scatter plots, best lines of fit and the equation of the trend line. Using the equation, they will estimate the unknown values of kid meals and supersized portions of french fries.
Subjects:
Grades:
8th - 11th
Types:
Showing 1-24 of 764 results


