255 results
Statistics independent works for Easel
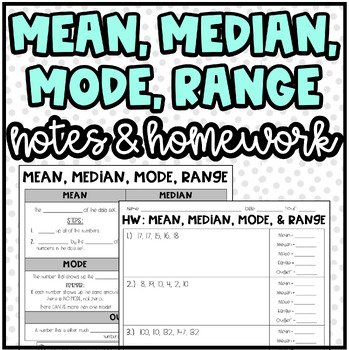
Mean, Median, Mode, Range, and Outlier | Notes and Homework or Practice
Notes & Homework: Mean, Median, Mode, Range, and Outlier:I used these notes, practice, and homework with my students. I used this lesson to serve as a "quick lesson" for the students. It covers how to find the mean, median, mode, range, and outlier.Product Includes:Notes Page with 2 examplesNotes Page Answer KeyHomework (10 organized problems with workspace provided)Homework Answer KeyThank You! ❤️I really appreciate your interest in my product! I love to create new things for my students! A
Subjects:
Grades:
5th - 8th
Two Way Tables Worksheet
Attention Math Teachers! Download this two-sided worksheet on completing two-way tables and analyzing bivariate data today! This worksheet is perfect for Pre-Algebra and Algebra 1 students as a classwork or homework activity.By completing this worksheet, students will check their understanding of how patterns in bivariate data can be seen by displaying frequencies and relative frequencies in a two-way table. They will also learn how to construct and interpret two-way tables, summarizing and inte
Subjects:
Grades:
8th - 9th
Types:
CCSS:
Also included in: Scatterplots Two Way Tables and Residual Plots Worksheets Bundle
Two Way Relative Frequency Tables Worksheet
Are you a math teacher looking for engaging classwork or homework activities to help your students with relative frequency tables? Look no further! Our worksheet on completing two-way tables and creating relative frequency tables is perfect for your needs. Great for Pre-Algebra and Algebra 1 students. With real-world situations and comprehension questions based on relative frequency tables, students will learn to summarize and interpret data collected from the same subjects. They'll construct an
Subjects:
Grades:
8th - 9th
Types:
CCSS:
Also included in: Scatterplots Two Way Tables and Residual Plots Worksheets Bundle
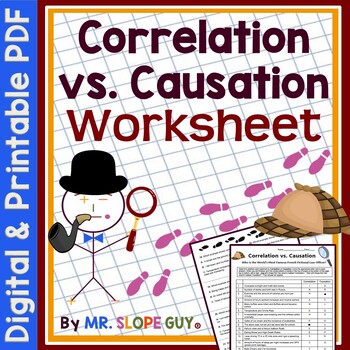
Correlation vs Causation Worksheet
Hello Math Teachers! Help your math students understand the difference between correlation and causation with our fun activity worksheet. Students will evaluate 42 statements and determine whether they demonstrate correlation or causation, and there are some multiple-choice questions as well. This activity also includes a puzzle that generates an answer, making it easy to grade.This two-sided worksheet is great for classwork or homework and is designed to help students develop critical thinking
Subjects:
Grades:
9th
Types:
CCSS:
Also included in: Algebra Math Riddle Worksheets
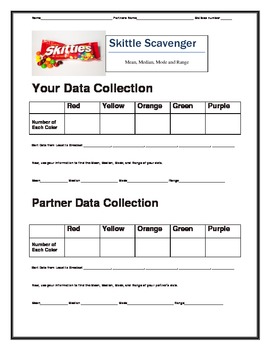
Skittles Candy with Mean, Median, Mode, Range, and Box and Whiskers Plot
This is a quick, fun activity to use with statistics. I have the kids bring in a pack of skittles and sort by color. Then all of the kids will find the Mean, Median, Mode, Range, and Box and Whiskers.
Subjects:
Grades:
4th - 8th
Types:
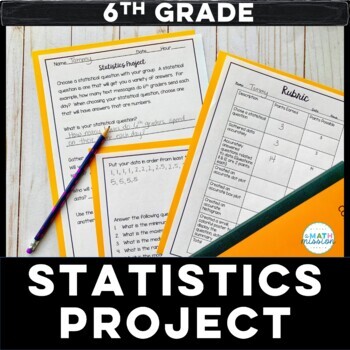
Math Statistics Project Based Learning Dot Plot Box Plot Histogram
Set your students loose to practice their statistics skills! This project is great for a culminating assessment. This project is centered around students coming up with a statistical question, and gathering data on that question. Students answer statistical questions, and create a dot plot, box and whisker plot and histogram based on the data collected. A summary of their findings is then created to display for others to see. A rubric is included for grading purposes. This project actively
Subjects:
Grades:
5th - 7th
Types:
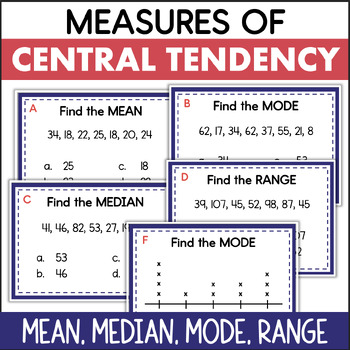
Mean Median Mode Range Measures of Central Tendency Data Task Cards
These data task cards are a great way for students to practice analyzing data to find the mean, median, mode, and range!There are several types of questions, all addressing measures of central tendency. Some require students to interpret a data set of whole numbers. Others involve data presented in a line plot. The last type of question requires the student to choose the correct method for finding the mean, median, mode, or range.This math resource includes:16 task cardsrecording sheetanswer key
Subjects:
Grades:
5th - 7th
Types:
Estimating Correlation Coefficient with Scatter Plots Worksheet
Attention Math Teachers! Are you looking for a way to help your students master estimating correlation? Look no further! Our engaging worksheet is designed to match scatter plots with the correct correlation coefficient. With a variety of reasonable choices, students will estimate the correct r value and interpret positive and negative slope, as well as the strength or weakness of the correlation coefficient of a linear fit.This two-sided worksheet comes with an easy-to-use key and is perfect fo
Subjects:
Grades:
9th
Types:
CCSS:
Also included in: Data and Statistics Worksheets Bundle
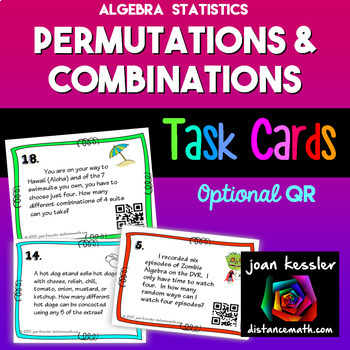
Permutations and Combinations Task Cards plus QR
This set of Combinations, Permutations, and Counting Task Cards with applications will really have your students thinking.This activity reinforces the concepts of permutations, combinations, and counting principles. The concepts are not separated on the cards, nor coded, so students must first decide what type of question it is before solving. The cards can also be used for a sorting activity. The difficulty levels are mixed on the cards. Included: Two sets of 24 cards, one with QR codes and
Subjects:
Grades:
7th - 10th
Types:
CCSS:
Also included in: Algebra 1 Activity Bundle
![Preview of Statistics Final Exam and Review [AP, College, and Honors]](https://ecdn.teacherspayteachers.com/thumbitem/Statisticis-FinalReviewStudy-Guide-Exam-1711356723/original-699492-1.jpg)
Statistics Final Exam and Review [AP, College, and Honors]
You can use this Statistics Final Exam in an AP Statistics, Honors Statistics, or a College Statistics course as an assessment, review or both. What's Included?Included are 6 different versions, each including 60 well chosen representative questions in both multiple choice format and also in free response format*. These reviews and tests work well in class or as a take- home. The tests are editable with Adobe Acrobat Pro. Each test should take about 2 - 3 hours and can be taken with a graphin
Subjects:
Grades:
10th - 12th, Higher Education
Types:
CCSS:
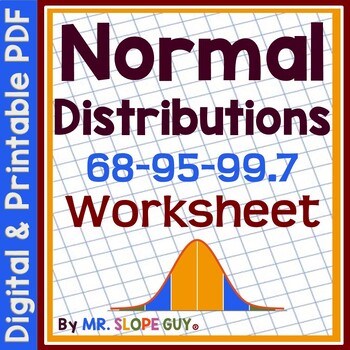
Normal Distributions Empirical Rule Worksheet
Hello Math Teachers! Do you want to help your students understand normal distributions and apply the Empirical Rule (64-95-99.7)? This worksheet can help! Students will practice interpreting real-world examples to find percentages, probability, and estimate data statements from distributions. They will also label parts of normal distributions when given mean and standard deviation, and identify key data points from the graphical distribution of data.This two-sided worksheet comes with an easy-to
Subjects:
Grades:
10th
Types:
CCSS:
Also included in: Data and Statistics Worksheets Bundle
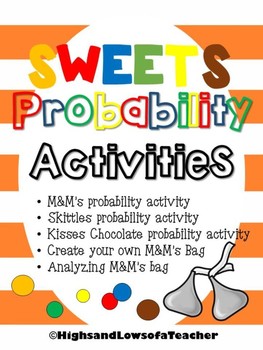
Sweets Probability Activities (chocolate, candy, M&Ms, Skittles, Kisses)
Uses chocolates or candy (M&Ms, Skittles, Kisses) to practice probability!
What's included-
*Colored candy probability activity: have students randomly pick colored candy and tally what's picked to experiment probability
*Colored candy probability activity reflection page- have students reflect on the experiment and explain their thinking
*M&M's probability activity: have students figure out how many M&M's are in a bag and what color of each by using probability
*M&M's probabil
Subjects:
Grades:
2nd - 8th
Types:
Also included in: Probability Activity BUNDLE
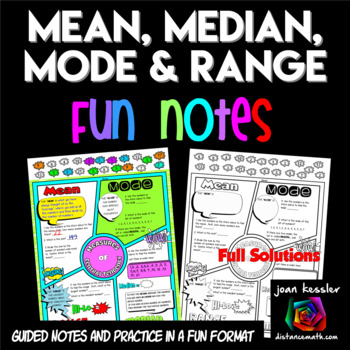
Measures of Central Tendency FUN Notes Doodle Pages
Your students will love learning the Measures of Central Tendency with these Fun Notes done in a comic book theme. Topics include Mean, Median, Mode, and Range. Students complete 6 problems plus definitions. There are two versions of the notes so you can differentiate. The PDF also includes 2 sizes, one standard 81/2 x 11" and the other in half size for INB's. Students love to doodle while learning and it has been shown that doodling and working with fun themed activities help students engage
Subjects:
Grades:
6th - 9th
Also included in: Algebra 1 FUN Notes Doodle Page Bundle
Residuals and Residual Plots Worksheet
Hello Math Teachers! Enhance your students' understanding of residual plots and scatter plots with this exciting activity!This two-sided worksheet focuses on understanding and creating residual plots. Your students will evaluate scatter plots as linear or quadratic, choose which ones should be modeled with linear or quadratic equations, create a scatter plot, write an equation to model data, determine if several residual plots would be a "Good Fit" for data, and calculate and construct a residua
Subjects:
Grades:
9th
Types:
CCSS:
Also included in: Scatterplots Two Way Tables and Residual Plots Worksheets Bundle
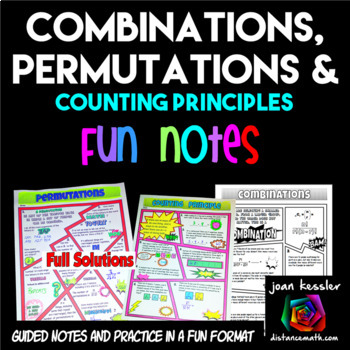
Permutations Combinations and Counting Principle FUN Notes Doodle Pages
Your students will love this Permutations, Combinations, and Counting Principle Fun Notes and Practice resource. Use it in class or as homework, assessment, or enrichment. A fun and engaging format for your students to learn the rules and practice their skills! Great for Algebra and Statistics.This resource contains 3 pages, one each for Permutations, Combinations, and the Fundamental Counting Principle. Students will complete a definitions and formula sections and complete over 20 problems.
Subjects:
Grades:
10th - 12th
CCSS:
Also included in: Algebra 2 FUN Notes Doodle Pages and Practice Bundle
5th Grade Data and Line Plots, 30 Enrichment Projects and 30 Test-Prep Problems
No-prep, 5th grade line plots and data math practice with 30 enrichment projects and 30 review test-prep questions aligned to the 5th grade math standards. A great way to teach the data standards in a fun, engaging way. Perfect for early finishers, advanced math students or whole class practice. Print and go math enrichment! These work perfectly for distance learning as well.This resource is aligned to the 5th grade math CCSS standards: 5.MD.B.2. (However, this resource is perfectly suitable t
Subjects:
Grades:
5th
Types:
CCSS:
Also included in: 5th Grade Math Projects For Every Standard! Enrichment All-Year Bundle!
Standard Deviation Worksheet
Hello Math Teachers! Enhance your students' understanding of standard deviation, mean, range, and variance with this comprehensive worksheet on calculating standard deviation!This two-sided worksheet includes scaffolded questions to help students begin and interpret similarities and differences using real-world situations. It's perfect for Algebra 1 classes as homework or as a classwork activity, and would be a great addition to any statistics and data analysis unit.This worksheet comes with an
Subjects:
Grades:
10th
Types:
CCSS:
Also included in: Data and Statistics Worksheets Bundle
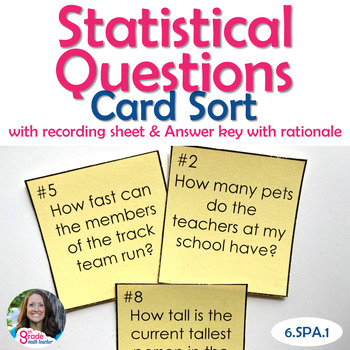
Statistical Questions Card Sort Activity
This card sort activity is perfect for helping students practice identifying, writing, and understanding statistical questions. The cards include a variety of questions, from simple to complex, that will challenge students to think critically about data. This resource can be used as a card sort or a task card activity.Cards Sort: This can be done in pairs or groups.Print and cut out the cards.Have students sort the cards into two piles: statistical questions and non-statistical questions.Discuss
Subjects:
Grades:
6th
Types:
CCSS:
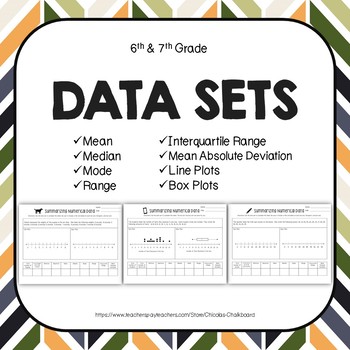
Data Sets: Mean, Median, Mode, Range, Interquartile Range, Box Plots, Dot Plots
Using this activity, students will be able to analyze data sets using box plots and dot plots. They will find the following: minimum, maximum, mean, median, mode, range, interquartile range, and mean absolute deviation. They will also create the box plots and dot plots using the data provided. This set includes: -Common Core State Standards-Two Reference Sheets (Key Data Set Terms and How to Create a Box Plot)-Four Different Data Worksheets 1. One data sheet that includes a completed dot p
Subjects:
Grades:
5th - 7th
Types:
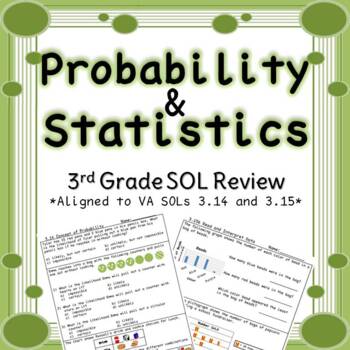
Third Grade Probability and Graphing Review
Now aligns to the new 2016 VA SOLs. This product is a 5 page practice packet/mixed review that aligns to 3rd grade VA Math SOLs. It covers all the SOLs in the 3rd grade Probability/Statistics Strand, including the following math topics:-Collecting Data-Organizing Data-Representing Data-Interpreting Data-Bar Graphs-Picture Graphs-Probability-CombinationsAn answer key is included for each page. This product can be used as whole group practice, small group practice, independent practice, remediatio
Subjects:
Grades:
2nd - 4th
Types:
Also included in: Third Grade Math SOL Review Bundle

Hypothesis Tests Introduction Statistics
My Statistics students always had trouble setting up the Null Hypothesis and the Alternative Hypothesis, and without understanding this, the tests and interpretations cannot be determined properly. Now I explain the unit and what Hypothesis Testing is all about first, and start them off with this set of notes and problems. At first they are excited not to do any math or calculations, but then the challenge begins.There are two sets of the problems, one multiple choice and the other mostly free
Subjects:
Grades:
9th - 12th
CCSS:
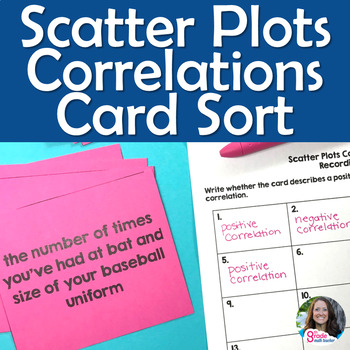
Scatter Plots Correlation Association Card Sort Activity or Task Cards
Get your students thinking with this scatter plots activity! This resource has 32 cards for students to investigate patterns of association (correlations) between two quantities (plus 4 blank cards). Use these as a card sort or task cards.Card sort: Students work in pairs or groups to sort the cards into 3 piles (positive association, negative association, or no association). As they sort, they give their reasoning why each card goes into the particular pile.Task cards: Students can work individ
Subjects:
Grades:
8th
Types:
CCSS:
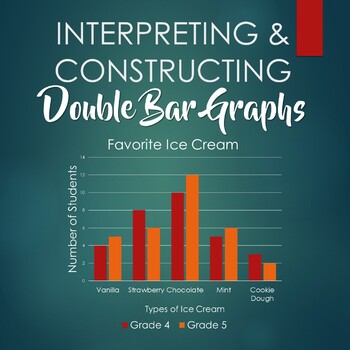
Interpreting and Constructing Double Bar Graphs - Booklet
This booklet includes six worksheets:- 3 double bar graphs for students to interpret- 3 sets of data for students to construct double bar graphs, with corresponding questions- answer key
Subjects:
Grades:
3rd - 6th
Types:
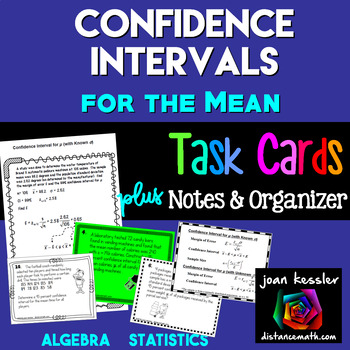
Confidence Intervals for the Mean
Your students will grasp Confidence Intervals for the Mean with this resource which includes Guided Notes, Task Cards, and a Graphic Organizer.What's Included?18 Task Cards for students to practice constructing confidence interval for the mean using the z - distribution and the t - distribution.Cards # 1 - 8 find Confidence intervals given statisticCards # 9 - 10 find Confidence intervals given dataCards # 11 - 12 find sample sizeCards # 13 - 15 find the margin of errorCards # 16 - 18 Given
Subjects:
Grades:
9th - 12th
CCSS:
Showing 1-24 of 255 results


