39 results
Statistics independent work images
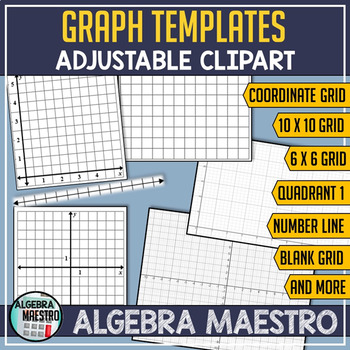
Adjustable Graph Templates
With Adjustable Graph Templates you'll receive a variety of graphs that are formatted to be easily adjustable, this is to help you create your own assignments. The full-page templates can be used as cut-outs, very useful for Foldables, and Interactive Notebooks. There are a variety of graph templates: coordinate axis (axes), 1st quadrant, number line, grid - and with a variety of units and sizes to suit your needs. To adjust a graph - click the desired graph and adjust the size by selecting-
Subjects:
Grades:
Not Grade Specific
Types:
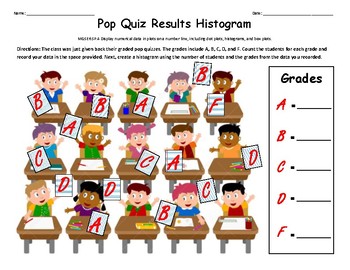
Histogram Pop Quiz
Histogram activity for standard:MGSE6.SP.4 Display numerical data in plots on a number line, including dot plots, histograms, and box plots.
Subjects:
Grades:
5th - 7th
Types:
Creating a Box Plot Steps
This product can be used as a resource for guided practice, notes, and/or as a scaffold. I love having my students glue it into their resource notebook so that they have it readily available to look back at whenever they want!Through an example, this graphic organizer includes steps on how to enter a list of data into the TI-84 Graphing calculator to find the 5 number summary. Then, it shows students how to interpret the 5 values and use them to draw a box plot on a number line.
Subjects:
Grades:
7th - 12th
CCSS:

Statistics Test Review: Inferences About the Slope
Statistics test review covering:
• Confidence intervals
• Correlation of determination
• Prediction & estimation
Students will review learned concepts of inferences about the slope. This review will give students an idea of what concepts they have mastered and what areas they need additional help on to achieve mastery.
• Answer Sheet Included •
===================================================
Related Items:
• Statistics Worksheet: Inferences About the Slope
• Statistics Worksh
Subjects:
Grades:
10th - 12th
Types:
Also included in: Statistics Bundle: Year Long Curriculum

Statistics Worksheet: Inferences About the Slope
Statistics worksheet covering:
• Inferences about the slope
You will receive a worksheet as well as fill in the blank notes with the purchase of this resource. Students will practice the necessary skills of inferences about the slope to be successful in Statistics.
• Answer Sheet Included
===================================================
Related Items:
• Statistics Worksheet: Inferences About the Slope
• Statistics Worksheet: Correlation of Determination
• Statistics Worksheet: Predi
Subjects:
Grades:
10th - 12th
Types:
Also included in: Statistics Bundle: Year Long Curriculum
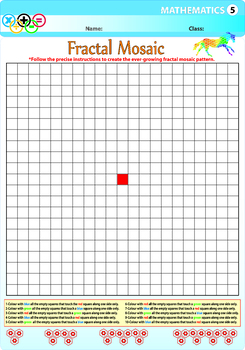
Fractal Mosaic Pattern
All worksheets are high quality (6956 - 9958 pixels) and illustrated.
Subjects:
Grades:
3rd - 5th
Types:
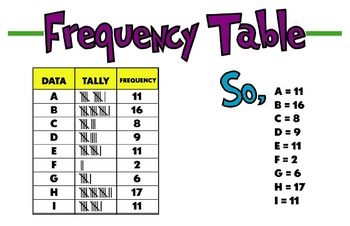
Frequency Table Poster
This poster can serve as a great anchor chart for students learning about Frequency Tables. It is formatted to print out at 11x17 but you can reduce it down for students to paste into a journal.
Subjects:
Grades:
3rd - 8th
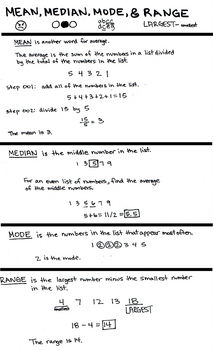
Basic Statistics: Mean, Median, Mode, and Range
An easy guide to learn Mean, Median, Mode, and Range.
Subjects:
Grades:
3rd - 12th
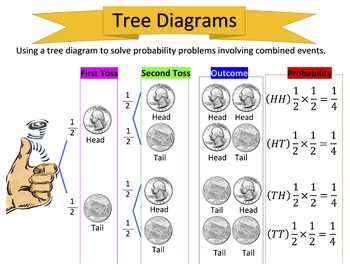
Probability & Tree Diagrams
Students will learn how to use a tree diagram to solve probability problems involving combined events.
Subjects:
Grades:
6th - 8th
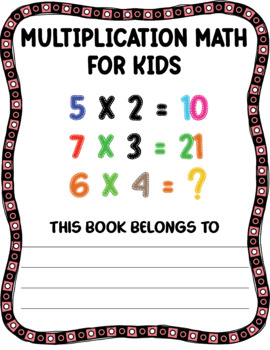
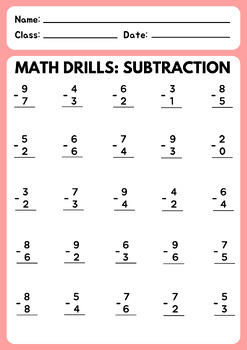
Practice thinking skills and enjoy multiplication math for kids.
For practice thinking skills and enjoy multiplication math for kidsSuitable for your childrenFor parents, you can easily download and print them at home. For children to practice skills.learning full of worksheets, activitiesfun exercise in math skills for kindergarten children.
Subjects:
Grades:
5th - 6th
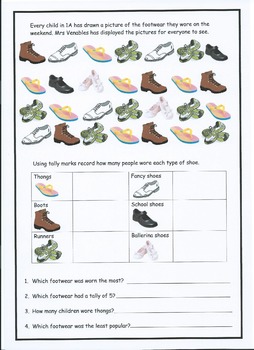
Tally Marks pt.2
This hand-out provides students with an opportunity to gain a stronger more consolidated understanding of tally marks. The activity is designed to follow Tally Marks pt.1 and will provide teachers with a wonderful tool to use in teaching students a concept that can be abstract in the early years.
Subjects:
Grades:
K - 2nd
Types:

Animals coloring book for kids
Animal Coloring Book for 3-6-Year-Old Kids (Future Teacher's Coloring Books for 3-6-Year-Old Kids).This fantastic and creative coloring book for children.
Subjects:
Grades:
Not Grade Specific
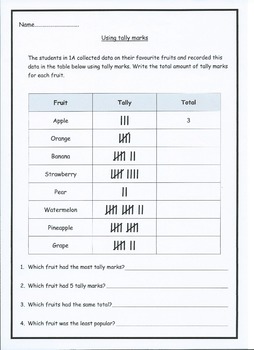
Tally Mark pt.1
This hand-out can be used as an introductory lesson to tally marks. Students will be given the opportunity to learn how to read and interpret tally marks. This activity allows students to interpret data and answer word problems based on a beginners understanding of tally marks.
Subjects:
Grades:
K - 2nd
Types:

Statistics Test: Inferences About the Slope
Statistics test covering:
• Confidence intervals
• Correlation of determination
• Prediction & estimation
Students will test their knowledge over learned concepts of inferences about the slope. This test will give students an idea of what concepts they have mastered and what areas they need additional help on to achieve mastery.
• Answer Sheet Included •
===================================================
Related Items:
• Statistics Worksheet: Inferences About the Slope
• Statisti
Subjects:
Grades:
10th - 12th
Types:
Also included in: Statistics Bundle: Year Long Curriculum
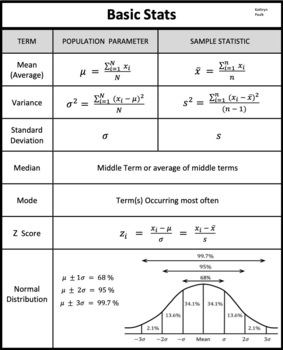
Basic Statistics (JPG)
Basic Statistics, Population and Sample Parameters, Mean, Median, Mode, Variance, Standard Deviation, Normal Distribution.
Subjects:
Grades:
6th - 12th, Adult Education
Types:
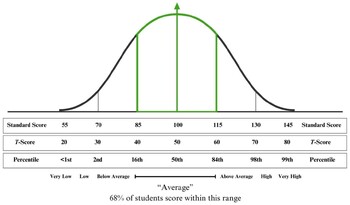
Bell Curve Diagram, Standard Scores, T-Scores, Percentiles
This bell curve diagram helps to illustrate standard scores, T-scores, percentiles, and qualitative descriptors. Print and bring to meetings to explain scores to team members, or include directly in your psychoeducational reports.
Subjects:
Grades:
Not Grade Specific
Types:
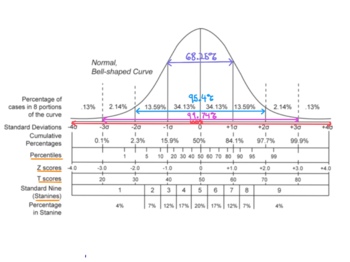
Bell Curve
Visual Aid/Mnemonic Device for remembering values on the Bell Curve. Useful for the NCE (National Counselor Examination), State Counseling Exams, and the Counselor Preparation Comprehensive Examination.
Subjects:
Grades:
Higher Education
Types:
Also included in: Psychology and Counseling Study Pack
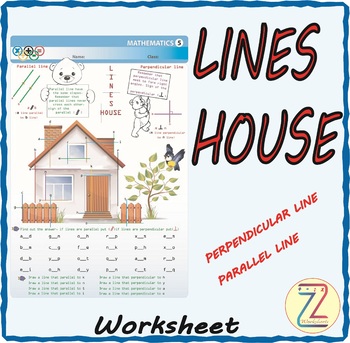
Lines House
Perpendicular line
Parallel Line
Definition of perpendicular and parallel
Finding the answer
Drawing new line
Subjects:
Grades:
1st - 5th
Types:
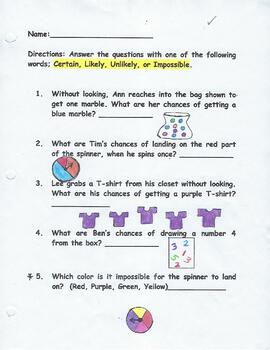
1st Grade Probability
1st graders need to learn whether events are certain, likely, unlikely, or impossible. That is what this sheet focuses on.
Subjects:
Grades:
1st - 2nd
Types:
Graphs
Pie chart
Bar graphs
Line Graphs
All worksheets are high quality (6956 - 9958 pixels) and illustrated.
Subjects:
Grades:
2nd - 5th
Types:
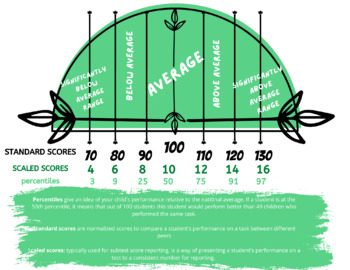
Bell Curve
Standardized Bell Curve Graphic to help psychologists, special education teams and other professionals explain normed data to others.
Grades:
Staff
Types:
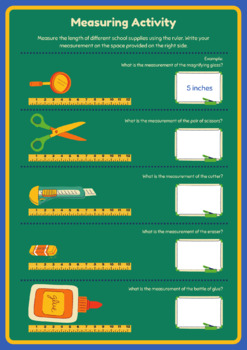
ورقة عمل ( قياس اللوازم المدرسية ) باللغة العربية و الانجليزية
ورقة عمل ( قياس اللوازم المدرسية ) باللغة العربية و الانجليزية
Subjects:
Grades:
PreK - 2nd
Types:
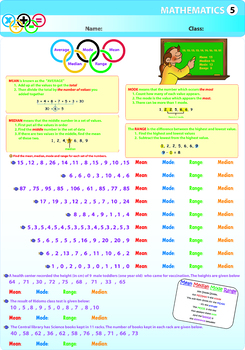
Average , Mode , Median , Range
Pupils can learn the topic and they can do practice
Subjects:
Grades:
4th - 6th
Types:
Showing 1-24 of 39 results


