57 results
9th grade statistics bulletin board ideas
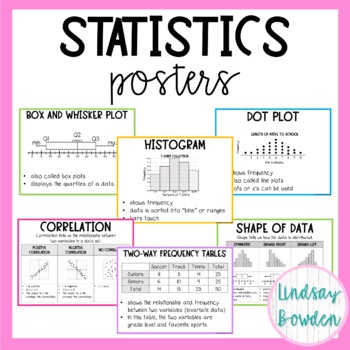
Statistics Posters (Algebra 1 Word Wall)
These statistics posters come with 18 posters on letter paper (8.5" by 11"). They are meant to be printed in color, but you can also print them in black and white.Posters include:box and whisker plots, histograms, stem and leaf, dot, plot, range, interquartile range, measures of central tendency, mean absolute deviation, shape of data, peaks in data, spread of data, scatter plots, correlation, causation vs. correlation, line of best fit, two-way frequency tables, standard deviation, normal dist
Subjects:
Grades:
8th - 10th
Also included in: Statistics Unit Bundle
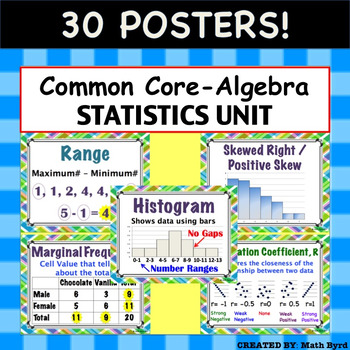
Common Core Algebra - Statistics Unit: Describing Data POSTERS
30 Posters! Each 8.5" x 11" in size. Posters are aligned with Common Core's Algebra - Statistics: Describing Data Unit. Posters Included:MeanMedianModeRangeInterquartile RangeOutlierMean Absolute DeviationMeasures of CenterMeasures of SpreadDot PlotHistogramBox PlotNormal/ Bell Shaped DistributionSkewed Right/Positive SkewSkewed Left/ Negative SkewUniform2 Way Frequency TableJoint FrequencyMarginal Frequency2 Way Relative Frequency TableConditional Relative FrequencyScatter PlotCorrelationCorrel
Subjects:
Grades:
8th - 11th
CCSS:
Also included in: Common Core Algebra 1 POSTERS - BUNDLE PRICE!
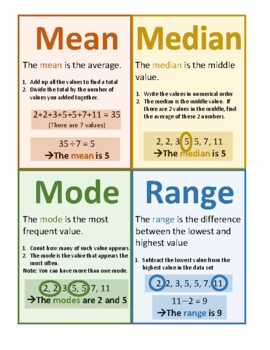
Mean Median Mode Range Poster Notes Anchor Chart
The PDF poster describes mean, median, mode, and range in an easy-to-understand and visual way. Enjoy!Check out my other posters here:STEM: Women in STEM Insp. Quotes, Women in STEM, Careers, Heroes Timeline, Inspirational Quotes from STEM HeroesABCs of Math: STEM Innovations, Amazing STEM facts, Careers, Shapes, in Nature Modern Style, in Nature Vintage Style, in Everyday LifeMath Vocabulary Alphabet: Elementary, Middle School, High SchoolMath in Art: Set A, Set B, Big BundleMath Modelling: Se
Subjects:
Grades:
5th - 9th
Types:
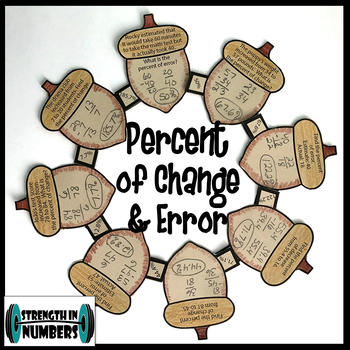
Percent of Change & Error Thanksgiving Fall Acorn Wreath
Your students will love this fall wreath. They will practice eight problems involving percent of error and change. Attaching each piece to the next piece with the correct answer makes a wreath. All my favorite things - self-checking, colorful, and wall-worthy! So adorable to display for Fall, especially Thanksgiving.Don't forget to earn TPT credits towards FREE products when you leave feedback! :)Check out my PAPER CHAINS:One and Two Step InequalitiesEaster – Solving ProportionsBasketball -
Subjects:
Grades:
6th - 9th
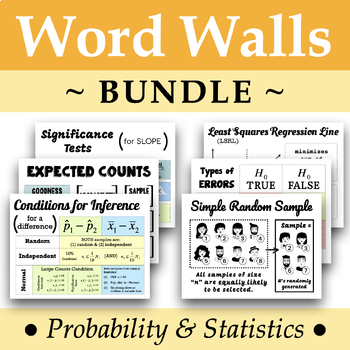
Statistic Word Wall BUNDLE
A bundle of the #1 to #12 Statistics Word Walls.
Subjects:
Grades:
9th - 12th
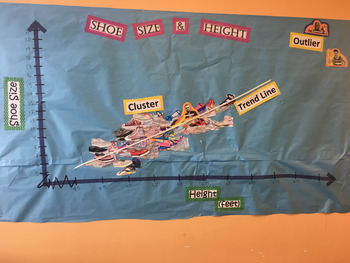
Class Shoe & Height Activity/Lesson
Really fun lesson on Scatterplots!
Each student colored their own mini shoe (included are cut outs of 4 popular shoes) then graphed it on a scatterplot of height and shoe size.. We then discussed clusters, made a trend line, and guessed Celebrity's shoe sizes based on their heights (cut outs also included). Vocab cards for labeling cluster, trend line, and outlier included.
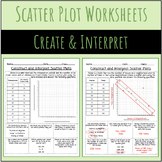
Also includes worksheet for students to make their own scatter plot and answer related questions.
Makes a really cute b
Subjects:
Grades:
6th - 9th
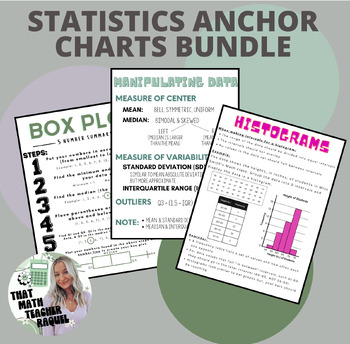
Statistics Anchor Chart Bundle
This Statistics Anchor Charts Bundle (including box plots, histograms, and manipulating data) can be referenced within your classroom while working on your one- and two-variable statistics unit. They are simple, easy to read, and have examples to follow along!There are various sizes for printing:• 8.5 x 11 in• 11 x 14 in• 12 x 18 in• 16 x 20 in• 25 x 30 in• 24 x 36 inI like to project the poster on to my board and trace onto chart paper. When I print my posters, I go to my local Walgreens! Other
Subjects:
Grades:
6th - 12th
Types:

Word Wall Vocab 107 Posters | Scientific Research/ Design Experimentation | HS
Vocabulary Posters for Scientific Research math words and includes 107 WORDS! for all Science/Research/ Statistics class for the entire year! These are perfect for Scientific Research and Design Experimentation that focuses on advance science, statistics and research experiments. Posters are horizontal and measures: 3.75" x 10.5". Perfect for the word wall and includes the following units: *Types of Sampling *Sampling Methods*Qualitative Sampling Methods*Basic Research Design*Quantitative and Qu
Subjects:
Grades:
9th - 12th
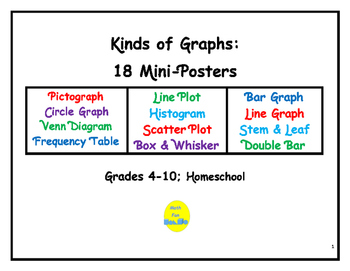
Kinds of Graphs: 18 Mini-Posters
These 18 mini-posters illustrate the various types of graphs studied in all grades: pictograph, line and bar graphs, box and whisker, stem and leaf, circle, histogram, Venn Diagram, matrix, scatter plot, and frequency tables. Each mini-poster contains a list of characteristics, an example, and vocabulary terms in bold face type.
By Math Fan
Subjects:
Grades:
5th - 9th
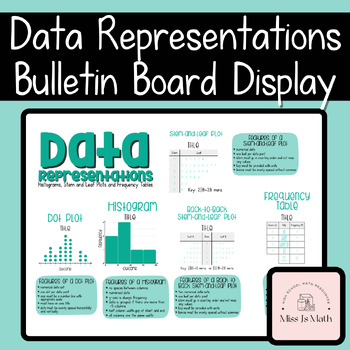
Data Representations Bulletin Board Wall Display - Graphs, Histograms, Stem&Leaf
This Data Representations Bulletin Board Wall Display includes a large selection of data displays and graphs along with their properties to simply print, cut and laminate. Elements are provided separately and in two different colours to allow for easy printing and co-construction with your class.Preview shows different elements provided.Display includes:Frequency tableDot plotHistogramStem and leaf plotBack to back stem and leaf plot
Subjects:
Grades:
7th - 10th
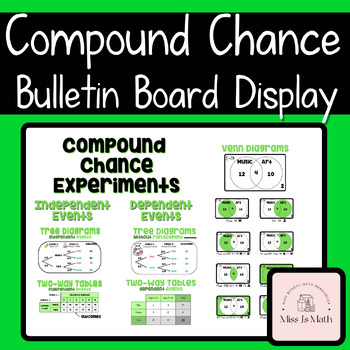
Compound Probability (Two Step Chance) Bulletin Board Wall Display
This Compound Probability (Two Step Chance) Bulletin Board Wall Display includes a range of displays for independent and dependent events, each supplied separately to simply print, cut and laminate.Display includes:Compound Chance Experiments titleIndependent Events titleDependent Events titleVenn Diagrams titleTree diagrams (dependent and independent)Two way tables (sample space and dependent events)Venn diagrams showing "and", "or" and complementary events
Subjects:
Grades:
7th - 12th
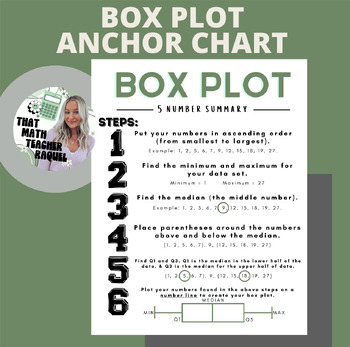
Box Plot Anchor Chart
This Box Plot Anchor Chart can be referenced within your classroom while working on your one- and two-variable statistics unit. It is simple, easy to read, and has an example to follow along!There are various sizes for printing:• 8.5 x 11 in• 11 x 14 in• 12 x 18 in• 16 x 20 in• 25 x 30 in• 24 x 36 inI like to project the poster on to my board and trace onto chart paper. When I print my posters, I go to my local Walgreens! Other recommendations for places to print are CVS, Walmart, or Staples. If
Subjects:
Grades:
6th - 12th
Types:
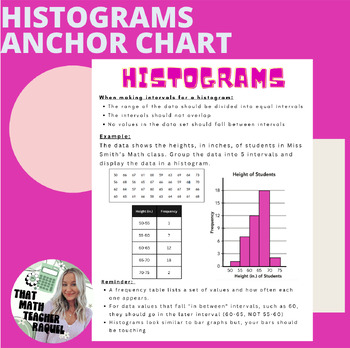
Histograms Anchor Chart
This Histograms Anchor Chart can be referenced within your classroom while working on your one- and two-variable statistics unit. It is simple, easy to read, and has an example to follow along!There are various sizes for printing:• 8.5 x 11 in• 11 x 14 in• 12 x 18 in• 16 x 20 in• 25 x 30 in• 24 x 36 inI like to project the poster on to my board and trace onto chart paper. When I print my posters, I go to my local Walgreens! Other recommendations for places to print are CVS, Walmart, or Staples.
Subjects:
Grades:
6th - 12th
Types:
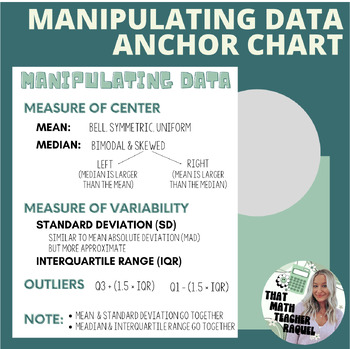
Manipulating Data Anchor Chart
This Manipulating Data Anchor Chart can be referenced within your classroom while working on your data unit involving one- and two-variable statistics. It is simple, easy to read, and has important notes your students should keep in mind!There are various sizes for printing:• 8.5 x 11 in• 11 x 14 in• 12 x 18 in• 16 x 20 in• 25 x 30 in• 24 x 36 inI like to project the poster on to my board and trace onto chart paper. When I print my posters, I go to my local Walgreens! Other recommendations for p
Subjects:
Grades:
6th - 12th
Types:
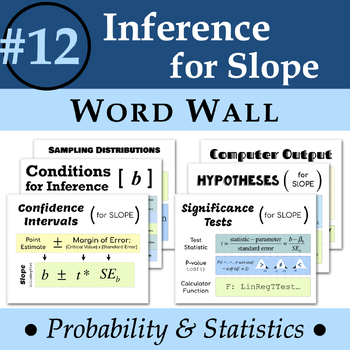
Statistics Word Wall #12: Inference for Slope
Statistics Word Wall #12: Inference for SlopeHelp your statistics students remember essential concepts and vocabulary with a visual word wall! Included are 6 letter-sized thematic posters that encompass over 12 terms! These terms align with Chapter 12 of TPS. TERMSSampling distributions of slope10% conditionNormality conditionConditions for inferenceConfidence intervals for slopeNull & alternative hypotheses for slopeSignificance tests for slopeTest statistic for slopeStandard error for slop
Subjects:
Grades:
9th - 12th
Also included in: Statistic Word Wall BUNDLE
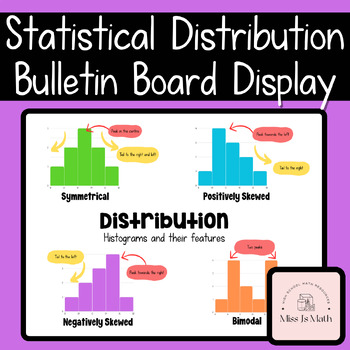
Statistical Distribution Bulletin Board Wall Display - Histograms & skewness
This Statistical Distribution Bulletin Board Wall Display includes properties of statistical distributions to simply print, cut and laminate. Elements are provided both as combined images and separately to allow for easy printing and co-construction with your class.Preview shows different elements provided.Display includes a symmetrical histogram, along with positively and negatively skewed graphs and a bimodal histogram. Arrows are included with explanations to show the peak/s and tail/s of the
Subjects:
Grades:
8th - 10th
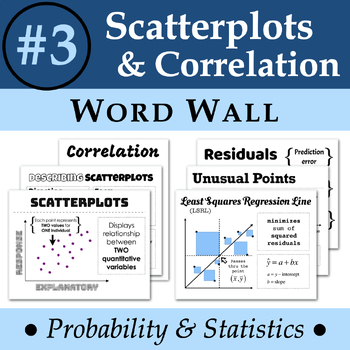
Statistics Word Wall #3: Scatterplots & Correlation
Statistics Word Wall #3: Scatterplots & CorrelationHelp your statistics students remember essential concepts and vocabulary with a visual word wall! Included are 6 letter-sized thematic posters that encompass over 20 terms & concepts! These terms align with Chapter 3 of TPS. TERMS & CONCEPTSscatterplotexplanatory variableresponse variabledirectionpositive directionnegative directionformlinear non-linear strength correlationresistantleast squares regression line (LSRL)y-intercept of L
Subjects:
Grades:
9th - 12th
Also included in: Statistic Word Wall BUNDLE
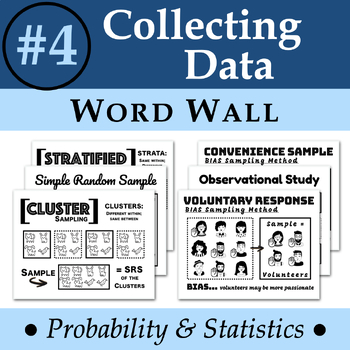
Statistics Word Wall #4: Observational Studies & Experiments
Statistics Word Wall #4: Observational Studies & ExperimentsHelp your statistics students remember essential concepts and vocabulary with a visual word wall! Included are 12 letter-sized thematic posters that encompass over 20 terms! These terms align with Chapter 4 of TPS. TERMSpopulation censussamplesurveyinferencestratifies random samplingstratacluster samplingclustersimple random samplingvoluntary response sampleconvenience samplesampling biasobservational studytreatmentexperimentsubject
Subjects:
Grades:
9th - 12th
Also included in: Statistic Word Wall BUNDLE
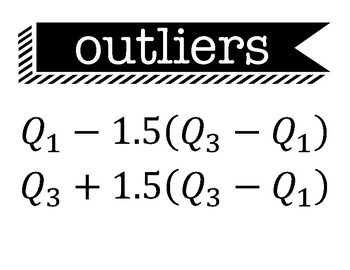
AP Statistics Formula Posters
These pages contain a great way to display the formulas students are required to know for the AP Statistics exam. These can be printed on 8.5"x11' paper and displayed in your classroom! This product contains 14 pages with the following formulas and definitions:OutliersResiduals, Standard score,Combining mean and variance,Converting mean and variance, Geometric Probability and mean,exponential and power model, definitions for confidence level, p value, and r squared
Subjects:
Grades:
9th - 12th, Higher Education, Adult Education
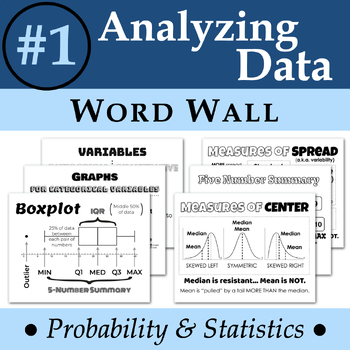
Statistics Word Wall #1: Analyzing Data
Statistics Word Wall #1: Analyzing DataHelp your statistics students remember essential concepts and vocabulary with a visual word wall!Included are 11 letter-sized thematic posters that encompass over 30 terms! These terms align with Chapter 1 of TPS. TERMSvariablescategorical variablequantitative variable two-way tablepie chartbar graphsegment bar graphside-by-side bar graphhistogramstemplotback-to-back stemplotboxplotdotplotfrequencyrelative frequencyconditional distributionmarginal distribut
Subjects:
Grades:
6th - 12th
Also included in: Statistic Word Wall BUNDLE
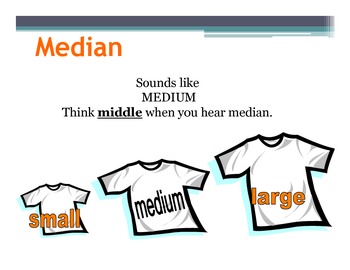
Math Posters:Mean, median, mode, range (30 Posters)
Mean, median, mode, range (30 Posters)
30 Beautiful and colorful posters.
I posted these posters in my classroom, and my students found the explanations very useful!!! (The last three slides are about Math songs (Mean, median, mode)
MY OTHER MATH POSTERS
Math Poster: SOHCAHTOA
Math Posters : Real Numbers
Math Posters : Tools For Algebra and Geometry (30 Posters)
Math Posters :Triangles (20 Posters)
Math Posters: 10 COMMON ERRORS IN ALGEBRA
Math Posters: Keywords of addition,subtraction
Subjects:
Grades:
4th - 12th, Higher Education, Adult Education, Staff
Bundle: Virtual Classroom Templates and Statistics Posters
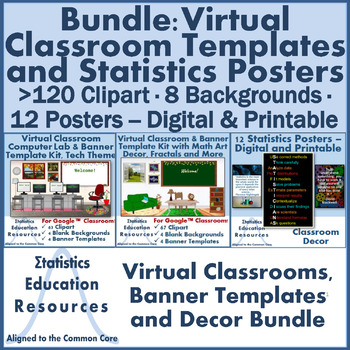
Bundle: Virtual Classroom Templates and Statistics Posters Are you teaching statistics, math or other STEM class? Are you doing distance learning in a virtual environment where you and your students depend on technology? Or do you just love technology or math-inspired art? If so, then let this virtual classroom and computer lab template kit, and statistics posters BUNDLE with a technology theme and STEAM decor help you save time. Multiple computers and monitors, technology devices, book cases,
Subjects:
Grades:
8th - 12th
Types:
Vocabulary Cards-Probability, Graphing, Mean/Median/Mode/Range, & more!
These vocabulary cards are perfect to display in a pocket chart or on a bulletin board during a probability and graphing unit. Many words include examples, and they are large enough to see from across the room. The cards are easy to make - simply print them on cardstock, cut them out, and laminate for durability. Mount them on colored construction paper if you'd like to enhance add some color to your display! Scroll over the thumbnail to see all the words in the file.
You might also be inte
Subjects:
Grades:
3rd - 12th
Statistics Word Wall #6: Random Variables
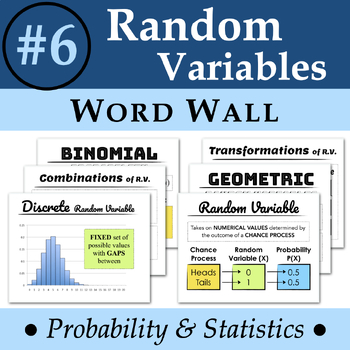
Statistics Word Wall #6: Random VariablesHelp your statistics students remember essential concepts and vocabulary with a visual word wall! Included are 12 letter-sized thematic posters that encompass over 20 terms & formulas! These terms align with Chapter 6 of TPS. TERMSrandom variablediscrete random variable expected valuemean of a discrete random variablestandard deviation of a discrete random variablecontinuous random variablelinear transformationscombinations of random variablesbinomial
Subjects:
Grades:
9th - 12th
Also included in: Statistic Word Wall BUNDLE
Showing 1-24 of 57 results


