12 results
Common Core HSS-ID.A.4 centers
Data Analysis and Statistics in Algebra 1 Google Forms Homework and Assessment
This Algebra 1 Google Forms bundle currently includes auto-grading assignments on the following skills related to data analysis and statistics:Measures of Central TendencyDot Plots and HistogramsBox PlotsStandard Deviation and The Empirical RuleTwo-Way Frequency TablesScatter PlotsEach assignment also includes a PDF "worksheet" for students to complete along with the form.All of the assignments in this bundle are also included in my:★ Algebra 1 (Semester 2) Google Forms BundleYou may also be int
Subjects:
Grades:
6th - 9th
CCSS:
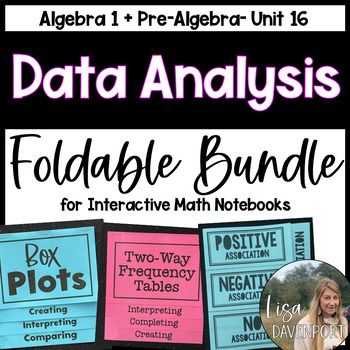
Data Analysis and Statistics Foldable Bundle
This foldable bundle includes skills associated with data and statistics taught within middle school math or algebra 1 standards:Mean, Median, Mode, RangeComparing CentersBox PlotsDot PlotsDisplaying Numerical DataAssociation within Scatter PlotsScatter PlotsWriting an Equation for a Trend LineStandard Deviation + The Empirical RuleData + Statistics in Algebra 1 Overview (Dot Plots, Histograms, Box Plots, + Two-Way Frequency TablesDetailed answer keys are included for each foldable.All of these
Grades:
7th - 10th
CCSS:
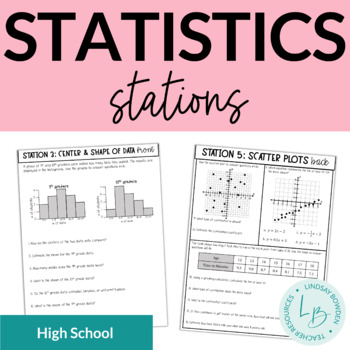
Statistics Stations
These statistics stations have 5 front and back stations that cover:histograms and dot plotstwo-way frequency tablescenter and shape of data (central tendency, peaks, symmetrical or skewed)spread of data (range, IQR, MAD)scatter plots (correlation, line of best fit, linear regression)Includes a student answer sheet and answer keys!Check out my YouTube video on stations here!You may also like:Box and Whisker Plots Notes & WorksheetsHistograms Notes & WorksheetsScatter Plots Notes and Work
Subjects:
Grades:
8th - 10th
Types:
CCSS:
Also included in: Statistics Unit Bundle
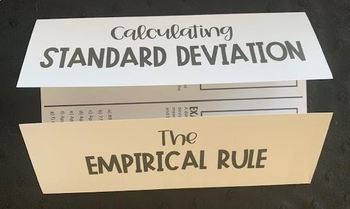
Standard Deviation and The Empirical Rule Foldable Notes - Fully Editable
This editable foldable provides students with an introduction to Standard Deviation and the Empirical Rule. There are two examples within the foldable along with steps and notes at the top of the page.Perfect for interactive math notebooks! I use this type of assignment during whole group guided instruction, but it would also work great for intervention, small group, centers, or during a tutoring session.This download includes a print + go PDF version, as well as the editable PowerPoint file.Th
Subjects:
Grades:
9th - 12th
CCSS:
Also included in: Data Analysis and Statistics Foldable Bundle
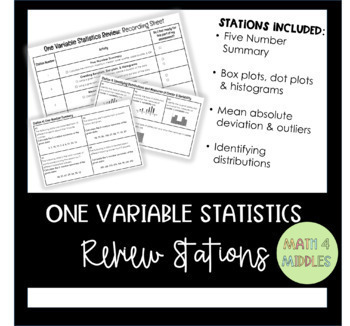
One Variable Statistics: Stations Review
Stations are a great way for students to practice skills or review for an upcoming assessment! Use this resource for your Algebra 1 students to review everything about one variable statistics.Station Topics Included:Five-Number SummaryCreating Boxplots, Dot plots, & HistogramsMean Absolute Deviation & OutliersIdentifying DistributionsTerms of Use:This product should only be used by the teacher who purchased it. This product is not to be shared with other teachers. Please buy the correct
Subjects:
Grades:
9th
Types:
CCSS:
10 Free Big Brain Math Problems
This is a sample of the 100 and 180 Big Brain Math Problem I have created with a couple of my students. I write these problems on the window of my classroom everyday and get about 5-10 students a day coming to try to solve them. It's been an enjoyable experience to have students come try the problem of the day and share their solutions with me. Please consider purchasing the 100 or 180 Big Brain Math Problems. There's enough for one a day for the entire school year and range from 1-5 Star diffic
Subjects:
Grades:
9th - 12th
Types:
CCSS:
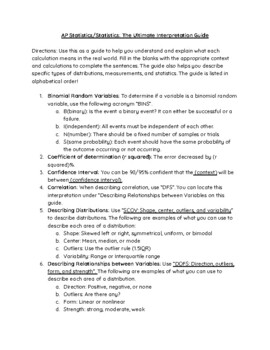
AP Statistics: Interpretations Guide: What does each statistic mean?
Hi teachers! This resource is great for your elementary, regular, or AP Statistics course. Students can use this guide all year long. We want our students to actually understand what they are calculating and connect their learning to real-world contexts! This resource will help them do just that. Some interpretations covered are mean, median, mode, and more. Here are the directions for use of the interpretations guide: Directions: Use this as a guide to help you understand and explain what each
Subjects:
Grades:
7th - 12th
CCSS:
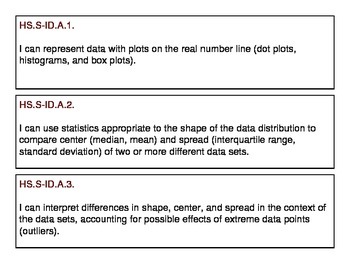
High School Probability and Statistics Concept "I Can" Statement Strips
This file contains all of the CCSS for the "Probability and Statistics" conceptual category in grades 9-12. This PDF can be printed and cut out to post for daily lessons. They will fit a pocket chart or you can add magnets to the back and display them on a magnetic whiteboard. Tabulated sections will keep your strips organized. They will fit perfectly in a file folder system or even a shoebox.
Subjects:
Grades:
7th - 12th
CCSS:
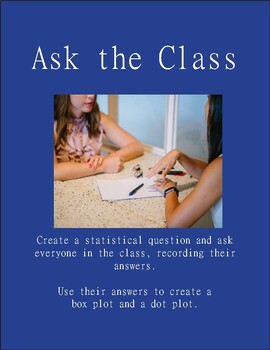
Ask the Class - surveying, box plots, normal curve, probability, correlation
Students will create their own statistical question and ask everyone in the class. They will use their data to draw a box plot and a dot plot. This is an introduction to what qualifies as a "statistical" question. There is an extension for high school math on pages 3, 4 and 5 that goes into correlation, normal curves and probability.
Subjects:
Grades:
6th - 11th
Also included in: 6th Grade Math Bundle

Algebra 1 Bundle
This contains all of the Algebra 1 materials I have created.
Subjects:
Grades:
9th
Types:
CCSS:

Algebra 2 Bundle
This contains all of the Algebra 2 materials I have created.
Subjects:
Grades:
11th
Types:
CCSS:
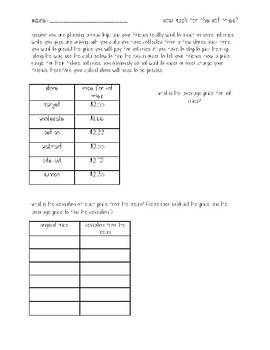
Mean Absolute Deviation Activity
This activity is aligned with the TransMath Unit 1 Lesson for Mean Absolute Deviation (MAD). Students should have prior exposure to MAD before completing the activity. Students' mission is to analyze the data given for various prices of Hot Fries. Students will need to analyze and interpret the data by finding the mean, as well as, MAD in order to inform their friends on a range they can expect to pay for the Hot Fries along their road trip.
Subjects:
Grades:
8th - 11th
Types:
CCSS:
Showing 1-12 of 12 results

