3 results
Statistics centers on sale

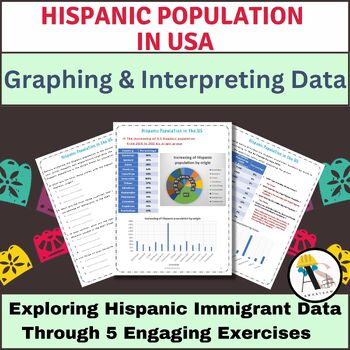
Trace Graphs and Interpret Data of Hispanic Population in USA Worksheet
Celebrate Hispanic Heritage Month with this engaging worksheet designed to challenge students to choose the most appropriate graph—whether it be bar graphs, line graphs, or pie charts—to visually depict information found in data tables concerning the Hispanic population in the USA. The worksheet includes 5 exercises related to the Hispanic population in the United States. Within this activity, students will have the opportunity to delve into various aspects of data representation and analysis :S
Subjects:
Grades:
6th - 9th
Types:
Also included in: Science and Math Activities Bundle for The Hispanic Heritage Month

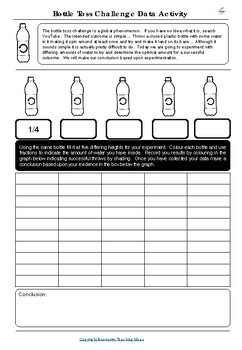
Bottle Toss Challenge | Data Collection | Statistics & Probability | Math & STEM
The bottle toss challenge is a global phenomenon. If you have no idea what it is, search YouTube. The intended outcome is simple... Throw a closed plastic bottle with some water in it, making it spin around at least once and try and make it land on its base... Although it sounds simple, it is actually pretty difficult to do. Today we will experiment with different amounts of water to determine the optimal amount for a successful outcome. We will make our conclusion based upon experimentat
Grades:
3rd - 6th
Types:

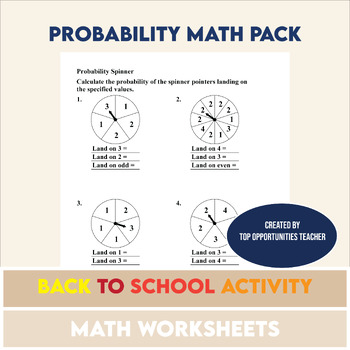
Probability Math Pack | Back to School Activity
Make teaching probability exciting with these hands-on fun probability activities! Contents:Probability spinner Solution
Subjects:
Grades:
5th - 12th
Types:
Showing 1-3 of 3 results


