132 results
Free 4th grade graphing assessments
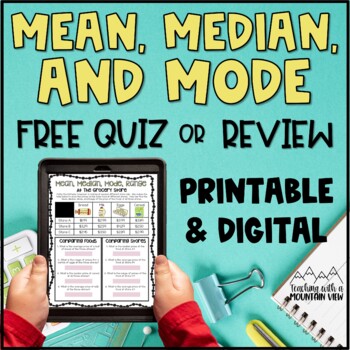
Free Mean Median Mode Range Quiz
This is a free PRINTABLE AND DIGITAL quiz or review activity that covers mean, median, mode, and range. What is covered in this mean, median, mode, and range quiz/review activity?I have included a range of questions to meet the needs of your students. Page #3 and #4 are a general review, with whole numbers and whole number answers. These pages are a great review for any students working on Mean, Median, Mode, and Range!Page #5 includes decimal calculations. In addition, several of the questio
Grades:
4th - 7th
Types:
Also included in: Mean, Median, Mode, and Range BUNDLE
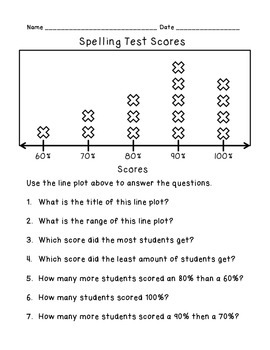
Line Plot Practice {FREEBIE}
I used this as an exit ticket for my students after I teach them about line plots. Happy learning!
Grades:
2nd - 4th
Types:
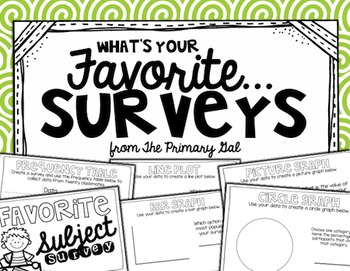
Collecting and Graphing Data Using Surveys
Looking for a way to have your students survey their classmates and record their data? This is activity allows students to collect and represent data in various ways such as frequency tables, line plots, bar graphs, and circle graphs.
Check out my blog post by clicking {here}.
Subjects:
Grades:
2nd - 5th
Types:
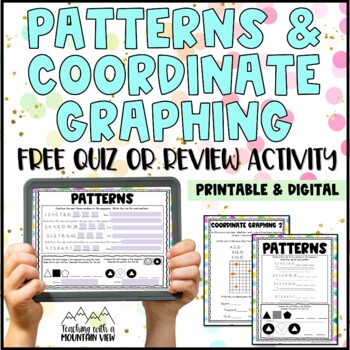
Patterns and Functions and Coordinate Graphing Activity
This free DIGITAL AND PRINTABLE quiz or review activity covers patterns, patterns and functions, and coordinate graphing. What is covered in this patterns and functions and coordinate graphing quiz/review activity?Patterns (find the pattern and write the rule, determine the visual pattern and continue)Patterns and functions (use the rule to create a pattern, continue the pattern in a table)Coordinate Graphing (create and label a graph to represent a data set, label the axis, write the coordinat
Grades:
4th - 6th
Types:
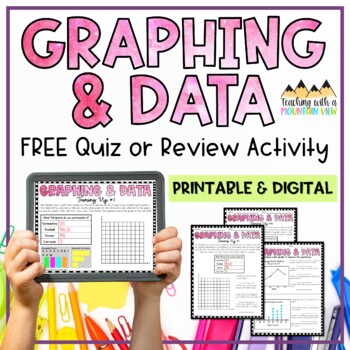
Graphing and Data Activity
Are you looking for a way to review graphing and data that is engaging and FREE? Need a printable AND digital activity to review interpreting and creating graphs and data tables? This is the resource for you! This activity is perfect as a simple assessment before a graphing and data unit to see what students already know, or as a summative assessment after your unit is complete! I’ve also used it as a fun review activity at the end of our unit. Concepts Covered Include:Interpreting line graphsI
Grades:
3rd - 4th
Types:
CCSS:
Also included in: Graphing and Data Bundle
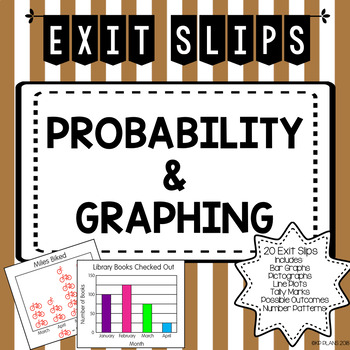
Graphing & Probability Exit Tickets FREE
20 3rd Grade Graphing & Probability Exit Slips! This entire set should cover your Graphing and Probability Unit.
Product covers:
Reading Bar Graphs
Creating Bar Graphs
Reading Pictographs
Creating Pictographs
Reading Tally Graphs
Creating Tally Graphs
Reading Line Plots
Creating Line Plots
Possible Outcomes/Possible Combinations
Patterns: Addition, Subtraction, Multiplication, Division, Shapes
These exit slips are the perfect way for you to see who understood your lesson that day! I us
Subjects:
Grades:
2nd - 4th
Types:
Also included in: Math Exit Tickets Bundle
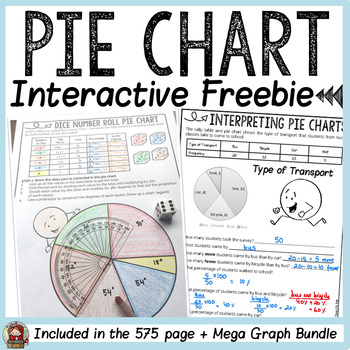
PIE CHARTS/ PIE GRAPHS/ CIRCLE GRAPHS FREEBIE
This freebie on interpreting and creating a pie chart is a sampler activity from the Mega Graphs Bundle.ITEMS INCLUDED✅ A poster defining a Pie Chart.✅ A one-page activity sheet to interpret collated data on mode of transport to school.✅ A one-page activity sheet that requires students to roll a dice and collect and interpret data. They will also find the percent and proportion of each sector to construct a pie chart using a protractor.✅ Answer key/completed sample of each graphing activity.****
Subjects:
Grades:
2nd - 6th
Types:
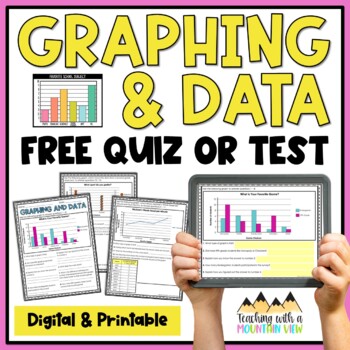
Graphing Quiz or Test
FREE Graphing Quiz! Test your students knowledge on various graphing and data concepts with this totally free digital and printable quiz. Which graphing and data concepts are covered in this free quiz?Bar GraphsBasic Interpretation of DataLine PlotLine GraphsPicto Graphs. What's included in this graphing freebie?Printable 3-page graphing and data quizAnswer KeyDIGITAL version of the quiz in Google SlidesLooking for more graphing and data resources? I've got you covered!'Under the Big Top' a Gra
Grades:
2nd - 4th
Types:
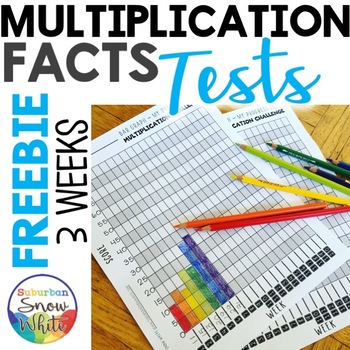
Multiplication Facts Tests Quizzes for Growth Mindset | Twelves 12s {Freebie!}
This unique kit requires zero correcting from the teacher, and parents and principals love it! Bar graphs provide students with immediate feedback on their progress. Testing only takes about ten minutes per week. Pretests get students in right mindset and post-tests help them apply their scores to terms like minimum, maximum, range, prime, composite, and rounding. People who have purchased the complete growth mindset tests have said the following:"OMG!!! Why did I not find this sooner!?! Such a
Subjects:
Grades:
3rd - 4th
Types:
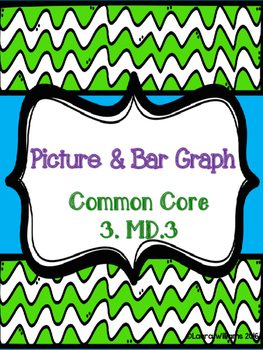
3.MD.3 Picture and Bar Graph
Included is a picture graph about favorite seasons with 6 common core aligned 3. MD.3 questions students have to answer. Then, 1 blank bar graph sheet where students take the data from the picture graph to draw a bar graph.
Subjects:
Grades:
2nd - 4th
Types:
CCSS:
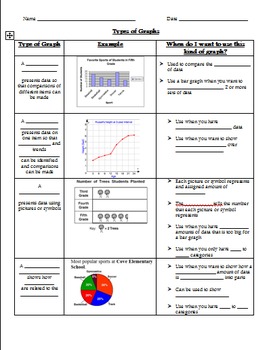
Types of Graphs Graphic Organizer
Multiple graphic organizers included. Students explore various types of graphs and learn about the characteristics and advantageous traits of each type, including line plot, histogram, line graph, circle graph, bar graph, stem-and-leaf plot, and double line graph. There are two types of graphic organizers included. The first is a basic graphic organizer that can also be used as an assessment in which students just identify the type of graph. In the second graphic organizer, students fill in key
Grades:
3rd - 7th
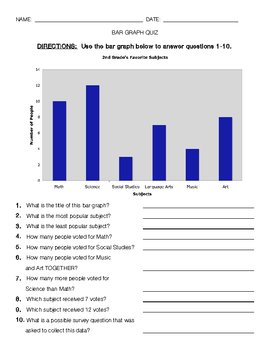
Bar Graph Quiz
This mini-assessment (10 questions) tests student ability to read and analyze a bar graph. Great to use for formative or summative assessment!
Subjects:
Grades:
2nd - 5th
Types:
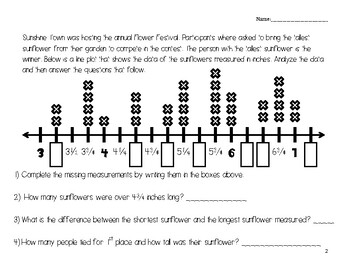
Fraction Line Plot
Needing to do a quick review on fractions or line plots?? This resource calls students to analyze data on a line plot while also exploring the relationship between measurements and fractions in mixed number form. I have also used this resource to address misconceptions in my small math groups. It's fast and can be accomplished within the small group time window! Questions scale from DOK Level 2-4! Font Credits: Hello Font
Subjects:
Grades:
3rd - 5th
Types:
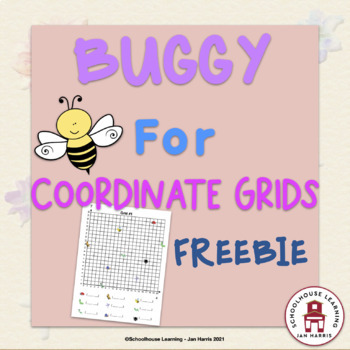
Buggy For Coordinate Grids
This product aligns to the 5th grade common core standard 5.G.1 and includes two worksheets that can be used to practice finding points on a coordinate grid. A fun way to practice finding points on a coordinate grid with your class. Laminate and have students use dry erase markers OR use it in a math center. Great as an assessment as well.Please leave feedback. Your comments are always welcome and appreciated.Follow me for more great products at great prices!My TpT Store - Jan Harris
Grades:
4th - 6th
Types:
CCSS:
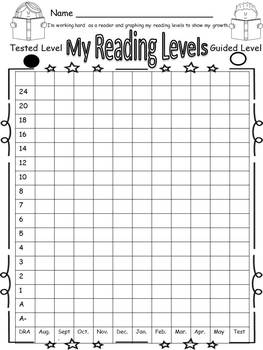
Reading Goal and Progress Graph
This is an editable progress/goal graph to chart student progress in reading. I believe it is important for students to set goals and see their growth. This graph can also be shared with parents to communicate progress and facilitate growth in reading.
My district currently uses DRA levels to track student reading progress. If you have a different leveling system this graph can be edited to suit your needs.
There are two circles used to track student progress. The filled in circle represen
Grades:
K - 6th
Types:
Class Survey Project - Data, Tables, and Graphs
This class project packet includes blanks for students to fill in with their own data gathered from classmates:
- Frequency Table
- Dot Plot (Line Plot)
- Bar Graph
- Pictograph
Students come up with their own survey questions and four possible answer choices. They will survey classmates and create representations based off of their data. The cover page is mostly blank so students can draw a picture to go along with their survey theme.
Grades:
3rd - 5th
Types:
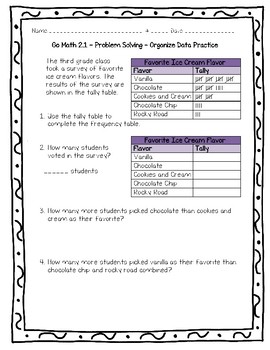
Go Math Practice - 3rd Grade 2.1 - Problem Solving Organize Data Practice
This is a worksheet with a review of the lesson 2.1 in the 3rd grade Go Math series: Problem Solving Organize Data
Can also be used as a quiz, formative assessment, review, extra help, or homework.
3.OA.D.8
Solve two-step word problems using the four operations. Represent these problems using equations with a letter standing for the unknown quantity. Assess the reasonableness of answers using mental computation and estimation strategies including rounding.
3.MD.B.3
Draw a scaled picture gra
Subjects:
Grades:
2nd - 4th
Types:
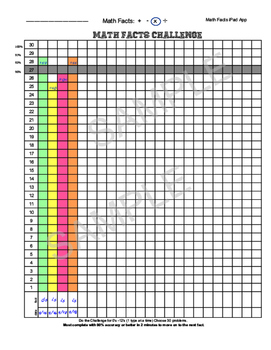
Math Facts Data Collection - Progress Monitoring Sheet
Use this handy sheet to collect daily data from math facts practice. I use an iPad app (Math Facts) and the students complete a 2 minute timed test on adding, subtracting, multiplying or dividing with a specific numeral until it is mastered.
Students can color in their score and have a visual of the progress!
Sample sheet included to help get you started :)
Subjects:
Grades:
1st - 6th
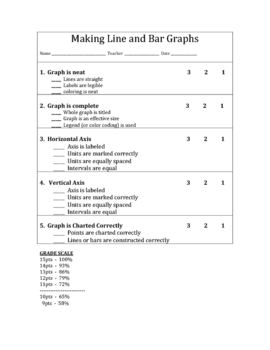
Making Line & Bar Graph Rubric (Grading Sheet)
A simple and easy-to-use rubric/grading sheet for both bar and line graphs. A copy could be attached to each graph graded. I simply list a string of numbers (with appropriate comments) that correspond to the domains of the rubric on the back of each graph. Then I put the rubric on an overhead when returning and discussing the graphs. This method is extremely fast and easy.
Grades:
4th - 10th
Types:
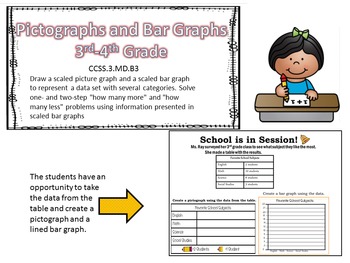
Graphs- Interpreting Data and Drawing Graphs (2 Separate Printables)
These two worksheets focus on interpreting data from graphs and plotting data in pictographs and lined bar graphs.
2 worksheets:
1. Interpreting Data from a Pictograph. There are 6 questions that ask "more than" and "less than" questions.
2. 4 worksheets of varying levels of difficulty to differentiate instruction.
-Level 1- One part of the pictograph is completed to show an example.
-Level 2- Pictograph is blank without assistance.
-Level 3- Students draw a pictograph from the table and a
Subjects:
Grades:
3rd - 4th
Types:
CCSS:
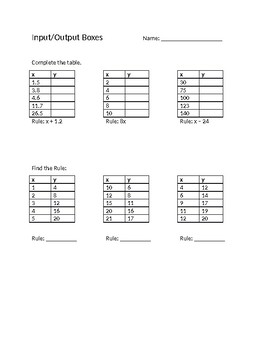
Graphing Input/Output Tables Worksheet
Starts with a brief review of input/output tables (including rules with decimals) then practices graphing the coordinates retrieved from completing an input/output table.*Make sure to choose enable editing once downloaded to fix formatting problems.
Grades:
4th - 6th
Types:

Make Your Own Survey - Bar Graph
Students will have to create their own question, record their peers' responses, and graph their data.
Great, simple recording sheet!
Grades:
K - 4th
Types:

Valentine Candy Heart Graphing Freebie
This graphing project is a great way to celebrate Valentine's Day while practicing graphing skills. This project can also be used as an assessment tool for the end of a graphing unit. Included in the download are pictures of a sample project, candy heart sort mat, title page, bar graph page, line plot and tally chart page, pictograph and graph observations page, graph labels, and project rubric for grading.
Subjects:
Grades:
2nd - 4th
Types:

Free Bar Graph Assessment
Below is a bar graph freebie aligned to third grade but could be used for second. Make sure to grab the full set of 10 bar graphs in my store.
Subjects:
Grades:
2nd - 4th
Types:
Showing 1-24 of 132 results


