Standard Deviation Activity - Temperatures - Bluman 3-3
Math Luvr
69 Followers
Description
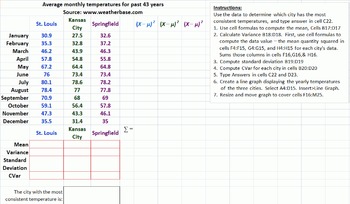
This is an Excel activity for students that has them compute the standard deviation and determine which cities have the most consistent temperatures. There is a worksheet for Missouri, New York, and South Carolina. Each worksheet has three major cities and the average monthly temperature. There is also a completed project so that you can compare the formulas used. In the Missouri worksheet, students find standard deviation by using sums, and taking the square root of the variance. In the subsequent worksheets, they explore the built in formulas Excel offers.
Detailed instructions for the activity appear on each worksheet. However, students do need to know how to input a formula, and some of the basic formulas of Excel, such as sqrt.
The previews show an uncompleted project and the completed project.
Detailed instructions for the activity appear on each worksheet. However, students do need to know how to input a formula, and some of the basic formulas of Excel, such as sqrt.
The previews show an uncompleted project and the completed project.
Total Pages
6 pages
Answer Key
Included
Teaching Duration
45 minutes
Report this resource to TPT
Reported resources will be reviewed by our team. Report this resource to let us know if this resource violates TPT’s content guidelines.


